




Here is the comprehensive technical article generated according to your specifications.
Abstract
This article provides a detailed technical analysis of How Does LEDLM-80PL Test System Work: LISUN LED Optical Aging Life Test. Designed for LED manufacturing and quality assurance professionals, the article explains the system’s dual architecture (LEDLM-80PL for LM-80/TM-21 and LEDLM-84PL for LM-84/TM-28), its reliance on the Arrhenius Model for accelerated aging, and the integrated software for lumen maintenance prediction. Readers will gain insight into the 6000-hour test protocols, L70/L50 metric calculations, and the critical role of temperature-controlled environments. The system ensures compliance with IES standards, offering a robust solution for validating LED lifespan.
1.1 Dual System Variants for Standard Compliance
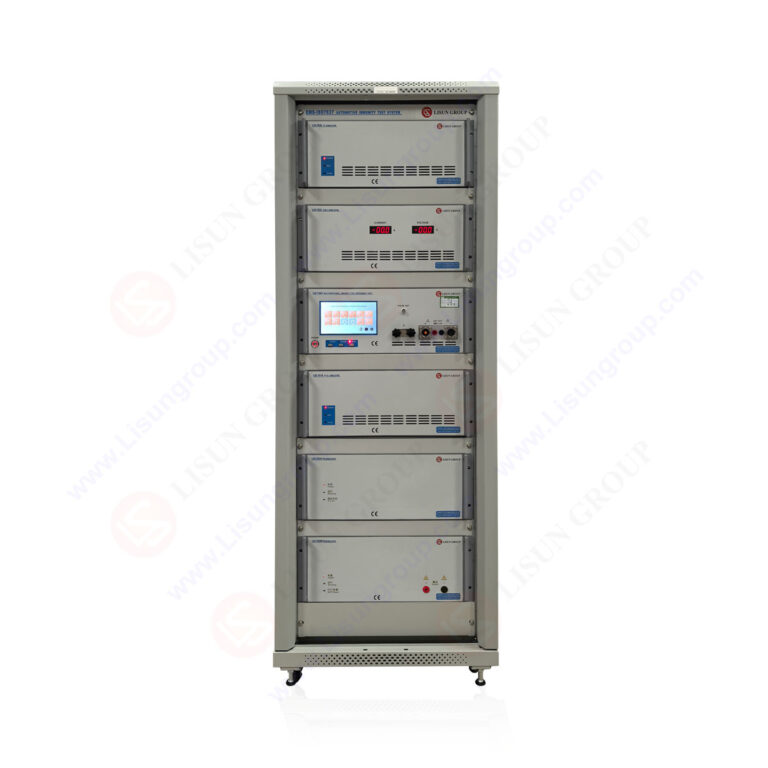
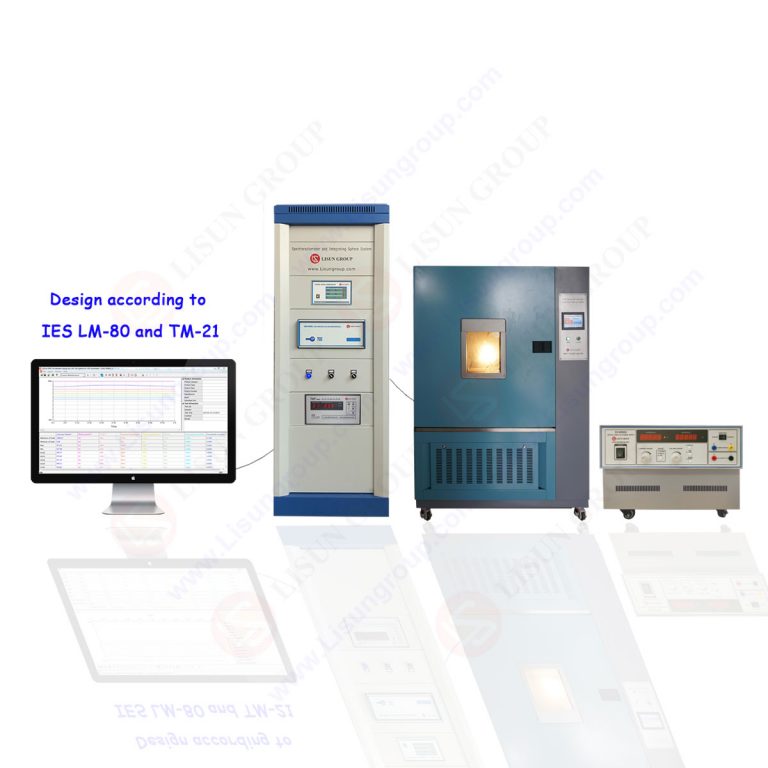
The LISUN product line addresses two distinct testing standards through separate hardware configurations. The LEDLM-80PL is specifically engineered to conform to IES LM-80-15, focusing on the lumen maintenance of LED packages, arrays, and modules. The LEDLM-84PL, conversely, is built for the IES LM-84-14 standard, which tests integrated LED lamps and luminaires. This deliberate separation ensures that test parameters—such as sample size, orientation, and measurement intervals—align precisely with the respective standard’s requirements. Both systems share a common optical measurement platform, but their firmware and software algorithms are calibrated differently.
1.2 Dual Testing Modes: Constant vs. Aging Mode
Each system operates in two primary modes to accommodate different validation stages. Constant Mode maintains a fixed current and temperature, monitoring photometric output (luminous flux, color temperature) at set intervals. This is ideal for baseline stability tests. Aging Mode, the core feature, subjects the DUT to accelerated stress cycles, including thermal cycling and high drive currents. This mode is critical for rapidly identifying failure mechanisms and early lumen depreciation. The software automatically switches between measurement and stress phases, ensuring uninterrupted data collection across the entire 6000-hour or longer test cycle.
2.1 Detailed LM-80 Testing Protocol
The LEDLM-80PL system executes the IES LM-80-15 standard by requiring a minimum of 6000 hours of testing, with data points recorded at 1000-hour intervals. The system manages up to three independent temperature chambers simultaneously, a key requirement for testing at 55°C, 85°C, and a manufacturer-selected third temperature (e.g., 105°C). This multi-temperature approach is mandated to generate sufficient data for the Arrhenius model. The system measures total luminous flux and chromaticity coordinates under a pulsed measurement current (typically 60mA for power LEDs) to minimize self-heating during measurement.
2.2 TM-21 Extrapolation and L70/L50 Reporting
Data from the LM-80 test, collected by the LEDLM-80PL, is directly input into the TM-21-19 algorithm for long-term projection. The system’s software calculates the L70 (70% lumen maintenance) and L50 (50% lumen maintenance) life hours. For example, a 6000-hour test at 85°C might yield an extrapolated L70 of 50,000 hours, depending on the observed decay rate. The software applies the least-squares exponential fitting defined by TM-21, reporting both projected life and confidence intervals, which is vital for manufacturer warranty validation.
2.3 LM-84 and TM-28 for Integral Lamps
The LEDLM-84PL system addresses the complexity of testing integrated luminaires where the LED is non-removable. Following IES LM-84-14, this system tests at ambient temperatures of 25°C and 45°C. The subsequent TM-28-14 extrapolation method, which uses an exponential fitting model similar to TM-21 but designed for lamp-level data, is fully automated within the LISUN software. This ensures that lamp manufacturers can accurately predict the service life of products like A-lamps or PAR lamps without the need for module-level teardown.
3.1 Thermodynamic Fundamentals in LED Testing
The LISUN software integrates the Arrhenius Model to correlate accelerated aging results with real-world usage. The model is expressed by the equation:
[
L_{op} = A cdot expleft(frac{Ea}{k cdot T}right)
]
Where ( L{op} ) is the operational life, ( A ) is a constant, ( E_a ) is the activation energy (typically 0.3–0.7 eV for LEDs), ( k ) is Boltzmann’s constant, and ( T ) is the junction temperature in Kelvin. The system’s software allows the user to set the activation energy based on the phosphor and chip material, enabling a more accurate prediction of failure rates under normal operating conditions.
3.2 Automated Multi-Temperature Analysis
To effectively utilize the Arrhenius model, the LEDLM-80PL system requires data from at least three case temperatures. The system automates this by controlling the thermal chambers to maintain precise junction temperatures. The software then performs a regression analysis to determine the activation energy from the test data. This automated analysis bypasses manual calculation errors and allows for the generation of a specific life-stress relationship for each LED type.
4.1 Integration with High-Precision Sphere and Array Spectroradiometer
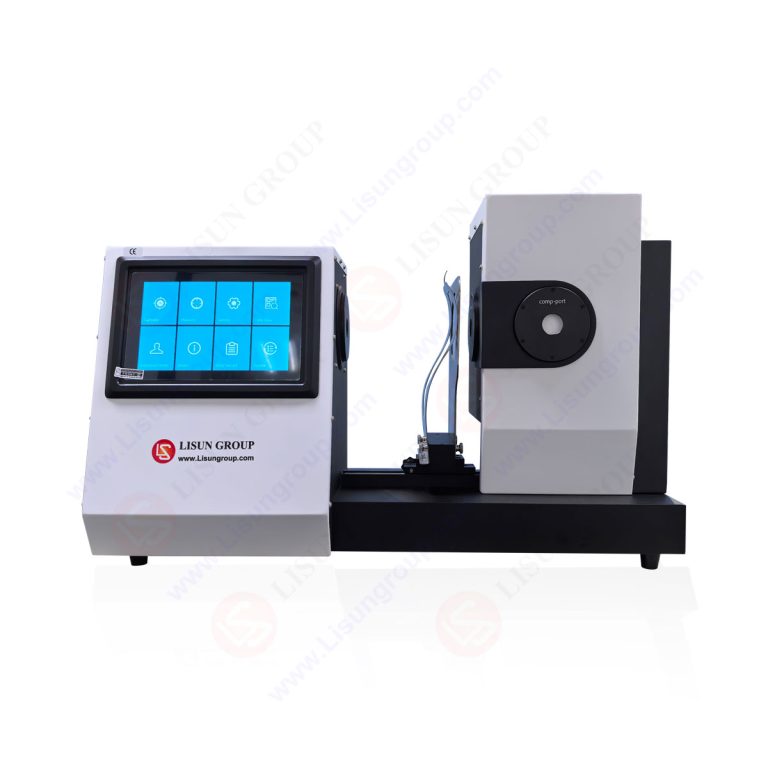
The system relies on a high-reflectance integrating sphere (typically 0.5m, 1.0m, or 2.0m diameter) coupled with the LISUN LSP-600 Series Spectroradiometer. This combination ensures measurement of CIE 127:2007 compliant total luminous flux. The spectroradiometer features a 2048-pixel CCD array, providing high-resolution spectral data from 350nm to 800nm. For the LEDLM-80PL, measurement accuracy for luminous flux is ±1.0%, with a repeatability of ±0.5%, meeting the stringent requirements of IES LM-79-19 for goniophotometric verification.
4.2 Electrical and Thermal Parameter Monitoring
Beyond optical output, the system simultaneously records electrical parameters—forward voltage (Vf), current (If), and power (W)—via a high-precision DC power supply and measurement unit. This data is essential for calculating efficacy (lm/W) and detecting early signs of electrical degradation, such as Vf drift. The system also monitors the thermocouple attached to the LED board (Tc point), ensuring the test temperature remains within ±1°C of the setpoint, as required by IES LM-80.
5.1 Data Logging and Real-Time Visualization
The LISUN LEDLM-80PL Manager software provides a real-time graphical interface displaying lumen depreciation curves, color shift (Δu’v’), and correlated color temperature (CCT) drift. Data is logged automatically every 1000 hours or more frequently during the aging phase. The software supports remote monitoring via Ethernet, allowing engineers to track multi-chamber tests from a single workstation. It generates both raw data tables and processed reports ready for submission to agencies like ENERGY STAR.
5.2 TM-21 and TM-28 Report Generation
A primary software function is the automated generation of TM-21 reports. The user selects the test duration (e.g., 3000h or 6000h) and the specific temperature data set. The software then calculates the decay rate (α) and the projected life (Lp). It also performs a chi-squared test to verify the exponential model’s fit. For the LEDLM-84PL, the output includes the TM-28 report, detailing the L70 and L50 values based on the lamp-level projection formula.
6.1 Modular Temperature Chamber Integration
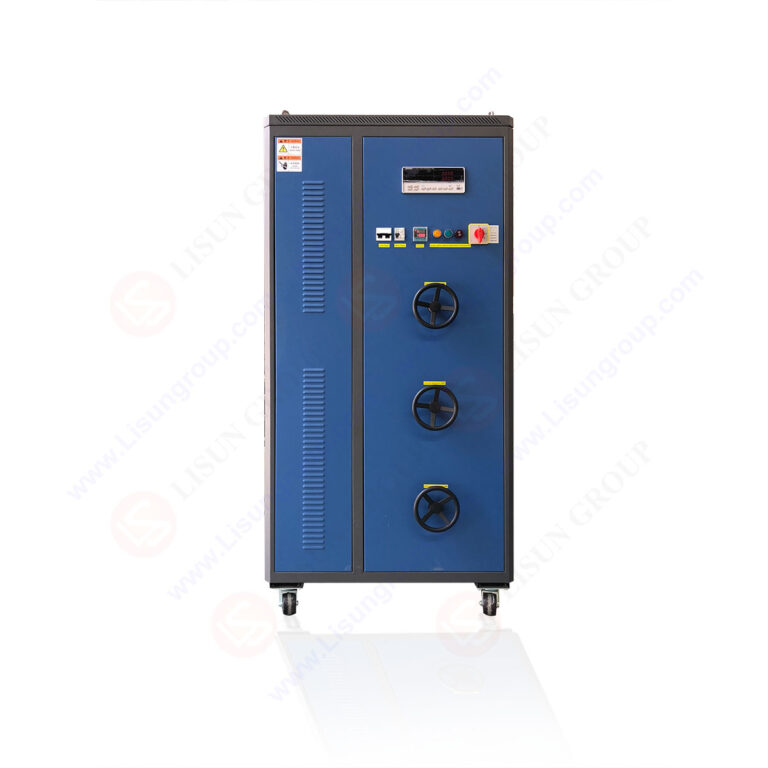
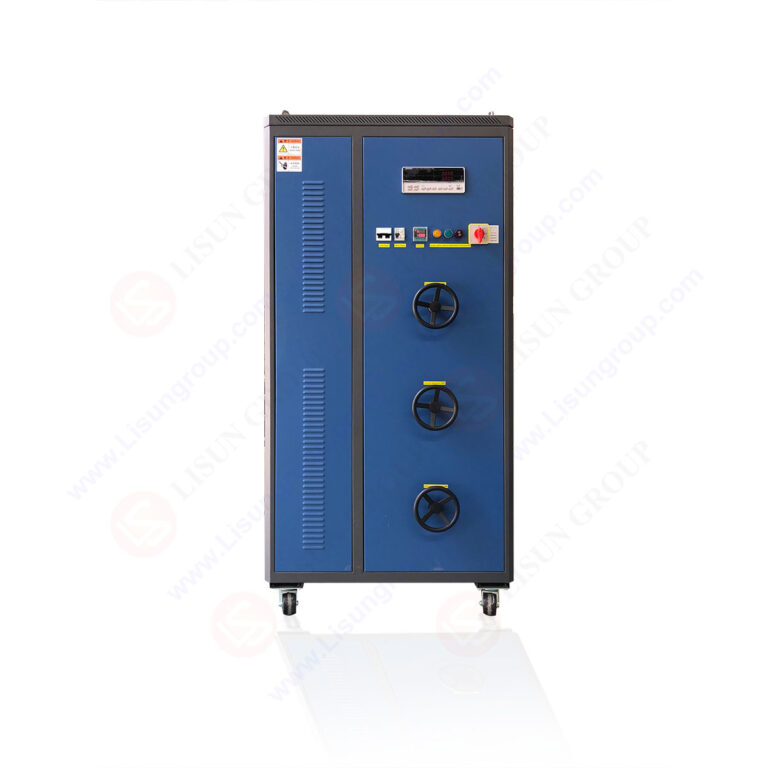
The system supports up to three independent temperature chambers (e.g., LEDLM-80TC/A series) that can be controlled via a single software interface. Each chamber has a temperature range of +20°C to +150°C, with a stability of ±0.5°C. The chambers are designed with independent sample trays, each capable of holding up to 20 LEDs for the LISUN standard test die. This modularity allows the user to simultaneously test different current levels or part numbers.
6.2 Technical Comparison Table
Below is a technical comparison of the two primary LISUN system variants.
| Feature | LEDLM-80PL (Package/Array) | LEDLM-84PL (Integrated Lamp) |
|---|---|---|
| Core Standard | IES LM-80-15 | IES LM-84-14 |
| Extrapolation Std | IES TM-21-19 | IES TM-28-14 |
| Min. Test Duration | 6000 Hours | 6000 Hours |
| Temperature Points | 55°C, 85°C, 105°C | 25°C, 45°C |
| Sample Configuration | LED on MCPCB (module) | Complete Lamp / Luminaire |
| Measurement System | Integrating Sphere (0.5m) | Integrating Sphere (1.0m/2.0m) |
| Electrical Specs | DC Drive (0-1A, 0-60V) | AC Drive (0-300V, 50/60Hz) |
| Data Reporting | L70, L50, Δu’v’ | L70, L50 (Lamp Life) |
7.1 Interpreting Lumen Depreciation Curves
The software plots lumen maintenance as a percentage of initial flux. A typical LEDLM-80PL curve for a high-quality LED might show only a 2% drop at 6,000 hours at 85°C. A steep curve (>5% drop) indicates a potential defect in the phosphor or die attach. The system flags these anomalies. The Arrhenius extrapolation then determines if this decay is acceptable for the 50,000-hour L70 target.
7.2 Managing Color Shift (Δu’v’)
The system continuously monitors chromaticity shift per IES LM-84. A shift of Δu’v’ greater than 0.006 can indicate phosphor degradation. The LEDLM-80PL software provides an alarm for this threshold. By analyzing the spectral power distribution (SPD) from the LSP-600, engineers can differentiate between blue-chip degradation (peak shift) and phosphor conversion shift (color ratio change), enabling targeted root cause analysis.
The LISUN LEDLM-80PL Test System provides a complete, automated solution for How Does LEDLM-80PL Test System Work: LISUN LED Optical Aging Life Test. By integrating dual hardware platforms for LM-80 and LM-84 standards, a sophisticated Arrhenius-based software engine, and precise optical measurement subsystems, it empowers engineers to generate reliable L70 and L50 projections. The ability to manage multiple temperature chambers and automate TM-21/TM-28 reporting drastically reduces the time from test initiation to certification report. For any R&D or quality control team, this system is the definitive tool for ensuring LED product longevity and regulatory compliance, meeting the highest standards of the lighting industry.
Q1: What is the minimum time required to get an L70 value using the LEDLM-80PL system?
A: According to IES LM-80-15, the minimum test duration is 6000 hours. However, the LISUN software utilizes the TM-21-19 algorithm to extrapolate L70 values from this 6000-hour data set. For a reliable extrapolation, the standard requires that the test duration be at least 6000 hours. While the system can generate preliminary projections at 3000 hours for engineering development, official compliance reports must be based on 6000 hours. The system accelerates this by running 24/7 in aging mode, but the physical test time cannot be reduced below the standard’s requirement.
Q2: Can the LEDLM-80PL system test different LED colors (e.g., red, blue, white) simultaneously?
A: Yes, but with calibration considerations. The LISUN spectroradiometer is a CCD array instrument that can measure any visible spectrum. However, the system’s software allows for the configuration of separate “test groups.” You can assign different calibration coefficients for phosphor-converted white LEDs versus monochromatic red LEDs. The system will automatically apply the correct calibration matrix based on the DUT’s identifier. It is crucial to perform an initial spectral calibration for each color group to ensure accurate luminous flux measurements, as a single calibration curve may not be linear across all wavelengths.
Q3: How does the system ensure the junction temperature (Tj) remains stable during the 6000-hour test?
A: The LEDLM-80PL system does not directly measure Tj; it measures the case temperature (Tc) via a K-type thermocouple. The software maintains a set Tc temperature by controlling the chamber’s airflow and heater. The relationship between Tj and Tc (Tj = Tc + (Rth-jc * Power)) is known from the LED datasheet. The system monitors the forward voltage (Vf) as a proxy for Tj, as Vf has an inverse linear relationship with temperature. If the Vf drifts unexpectedly, the software adjusts the cooling or heating to maintain the target Tc, ensuring consistent stress conditions over the entire test duration.