




Here is the comprehensive technical article generated according to your detailed instructions.
Abstract
This article provides a technical deep dive into the LED Optical Aging Test Instrument: Automated L70/L50 Prediction per IES LM-80, specifically focusing on LISUN’s LEDLM-80PL and LEDLM-84PL dual-system platforms. For reliability engineers and lab managers, accurate lumen maintenance prediction is critical for product warranties and regulatory compliance. This article details how the automated system utilizes the TM-21 statistical method and Arrhenius Model software to predict L70 and L50 lifetimes from 6000-hour test data. We analyze the dual testing modes (integrating sphere vs. goniophotometer), the significance of IES LM-80 and LM-84 standards, and the hardware configurability that supports up to three simultaneous temperature chambers. The technical discussion includes comparative performance data and a breakdown of how the system mitigates common errors in accelerated aging validation.
1.1 The Critical Need for IES LM-80 Compliance
The lighting industry relies on standardized test methods to ensure LED product longevity. IES LM-80-15 specifies the method for measuring lumen depreciation of LED light sources, requiring a minimum of 6000 hours of data at three distinct case temperatures (typically 55°C, 85°C, and a third selected temperature). The LED Optical Aging Test Instrument: Automated L70/L50 Prediction per IES LM-80 addresses the labor-intensive nature of manual data collection and the complex statistical analysis required by TM-21. Without automation, engineers face significant risks of data transcription errors and misinterpretation of extrapolation limits.
1.2 System Variants: LEDLM-80PL vs. LEDLM-84PL
LISUN offers two primary configurations tailored to specific standards. The LEDLM-80PL is designed explicitly for IES LM-80 and TM-21 testing, supporting single LED packages, modules, or arrays. The LEDLM-84PL is configured for IES LM-84 and TM-28 standards, which apply to integral LED lamps and luminaires. Both systems share core hardware like the Arrhenius model software and dual-mode photometric measurement, but the software algorithms differ to comply with the distinct sample size requirements and failure criteria of each standard. This modularity allows a single lab to cover component and full-product validation.
2.1 Photometric Measurement: Integrating Sphere vs. Goniophotometer
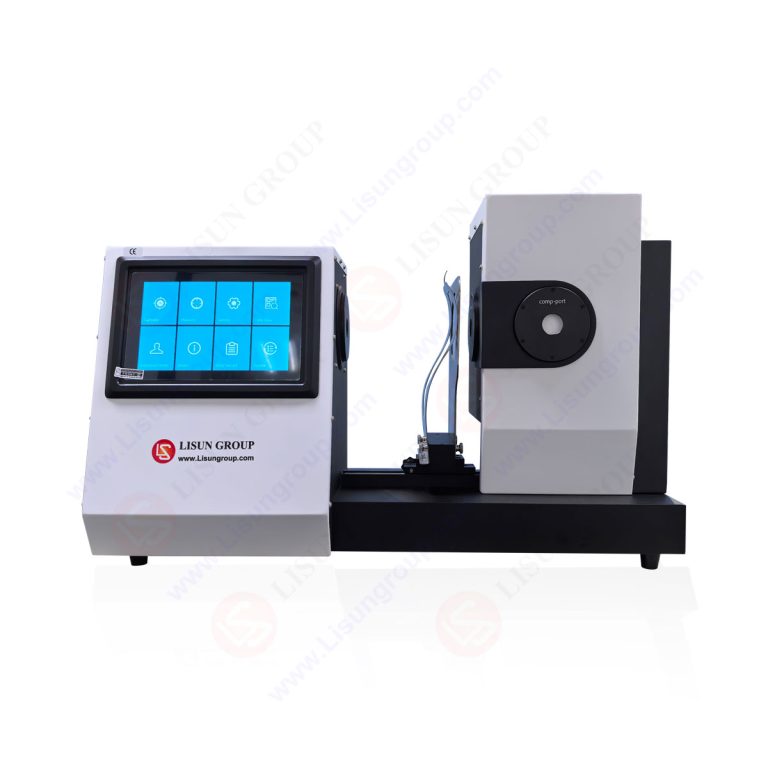
The system operates in two primary testing modes to capture total luminous flux. Mode 1 uses a 2-meter integrating sphere (per IES LM-79-19 and CIE 127) for rapid, high-accuracy total flux measurements of small sources. Mode 2 utilizes a mirror goniophotometer for larger luminaires, ensuring compliance with CIE 70 for spatial luminance distribution. The automated switching between modes is controlled by the software, which records data in 1000-hour increments up to the mandatory 6000-hour baseline.
2.2 The Role of TM-21 and TM-28 in Lifetime Prediction
While LM-80 provides raw data, TM-21-19 provides the statistical framework for projecting lumen maintenance (L70). The LED Optical Aging Test Instrument: Automated L70/L50 Prediction per IES LM-80 integrates TM-21’s exponential decay model directly into the software. For integral lamps, TM-28-22 is applied, which uses a different nonlinear fitting algorithm to account for driver-induced failures. The system automatically calculates the 6x rule (extrapolation limited to 6x the test duration), ensuring that a 6000-hour test only generates a valid L70 prediction up to 36,000 hours (approx. 4.1 years).
3.1 Dual Temperature Chamber Integration System
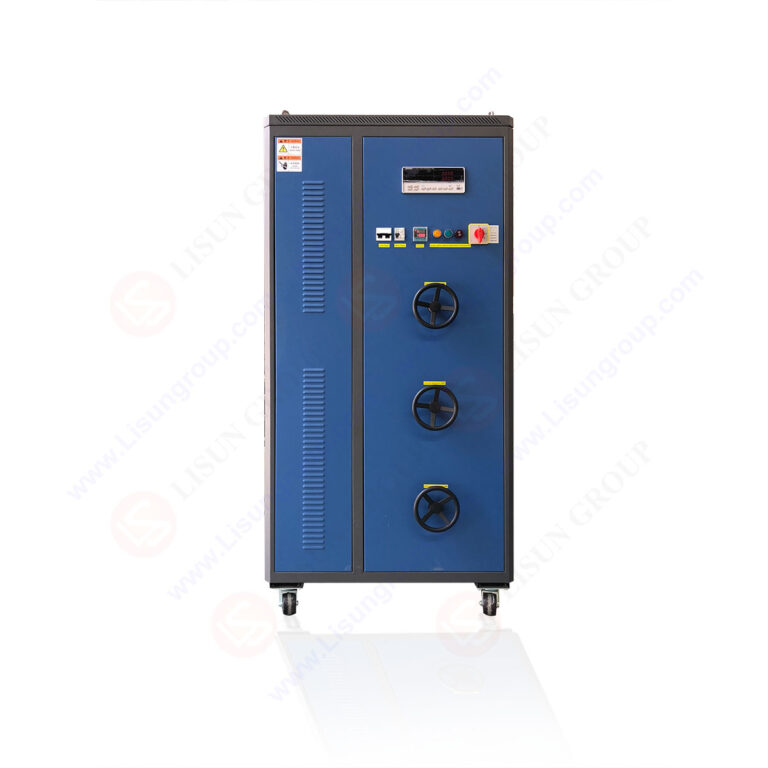
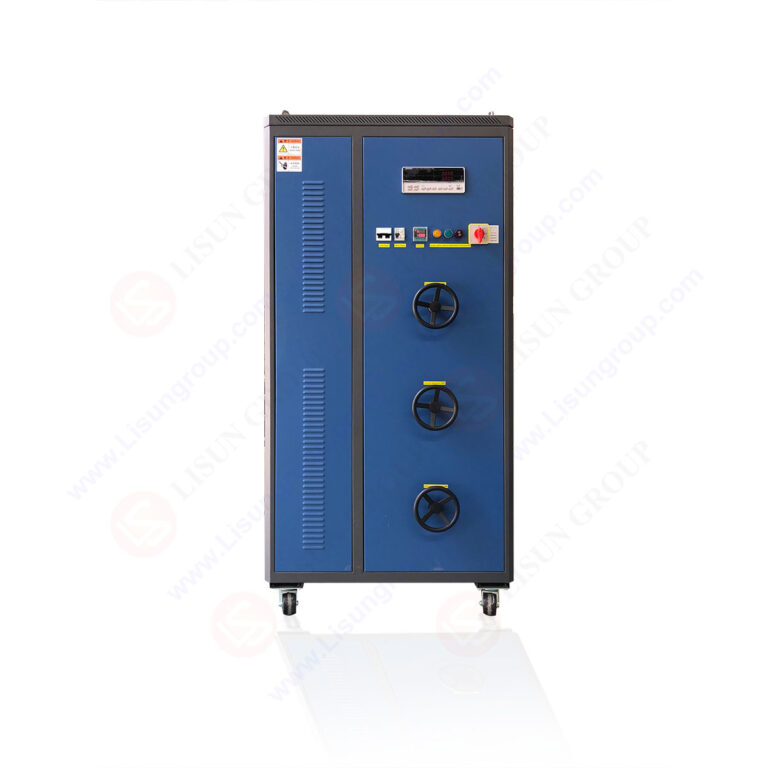
A key differentiator of this system is its ability to connect up to three independent temperature chambers simultaneously. Each chamber can be set to a different case temperature (Ts) as required by LM-80. The system supports a total of 192 test positions across three chambers (e.g., 64 per chamber). This parallel processing capability drastically reduces the total test cycle from months to the required 6000-hour runtime, as all temperatures run concurrently. The software logs the Ts at each test point, correlating temperature drift directly with lumen decay.
3.2 Power Supply and Data Acquisition Precision
The power supply system provides a DC output with an accuracy of ±0.1% for voltage and current. The photometric measurement system utilizes a Class A spectroradiometer (0.5 nm resolution) and a high-sensitivity CCD detector. The table below compares the two primary system configurations regarding measurement uncertainty.
| Specification | LEDLM-80PL (Components) | LEDLM-84PL (Luminaires) |
|---|---|---|
| Primary Standard | IES LM-80, TM-21 | IES LM-84, TM-28 |
| Test Sample Type | LED packages, Arrays | Integral LED lamps, Luminaires |
| Recommended Sphere Size | Ø 300 mm or 1000 mm | Ø 2000 mm |
| Temperature Control Accuracy | ± 0.5°C | ± 1.0°C |
| Max. Test Duration | 6000+ hours (continuous) | 6000+ hours (continuous) |
| L70 Extrapolation Limit | 36,000 hours (6x rule) | 36,000 hours (6x rule) |
| Data Logging Interval | User-defined (min. 1 hr) | User-defined (min. 1 hr) |
4.1 Automated TM-21 Exponential Decay Analysis
The core software engine treats lumen depreciation as a complex exponential function (Φ(t) = B * exp(-αt)). The system automatically performs nonlinear regression on the collected data points, rejecting the first 1000 hours of data (burn-in period) to meet TM-21 requirements. The software then calculates the decay rate (α) and the projected L70/L50 time. The user interface displays the fitted curve against raw data points, allowing engineers to visually validate the model’s accuracy before submitting the report.
4.2 Predictive “What-If” Scenario Generation
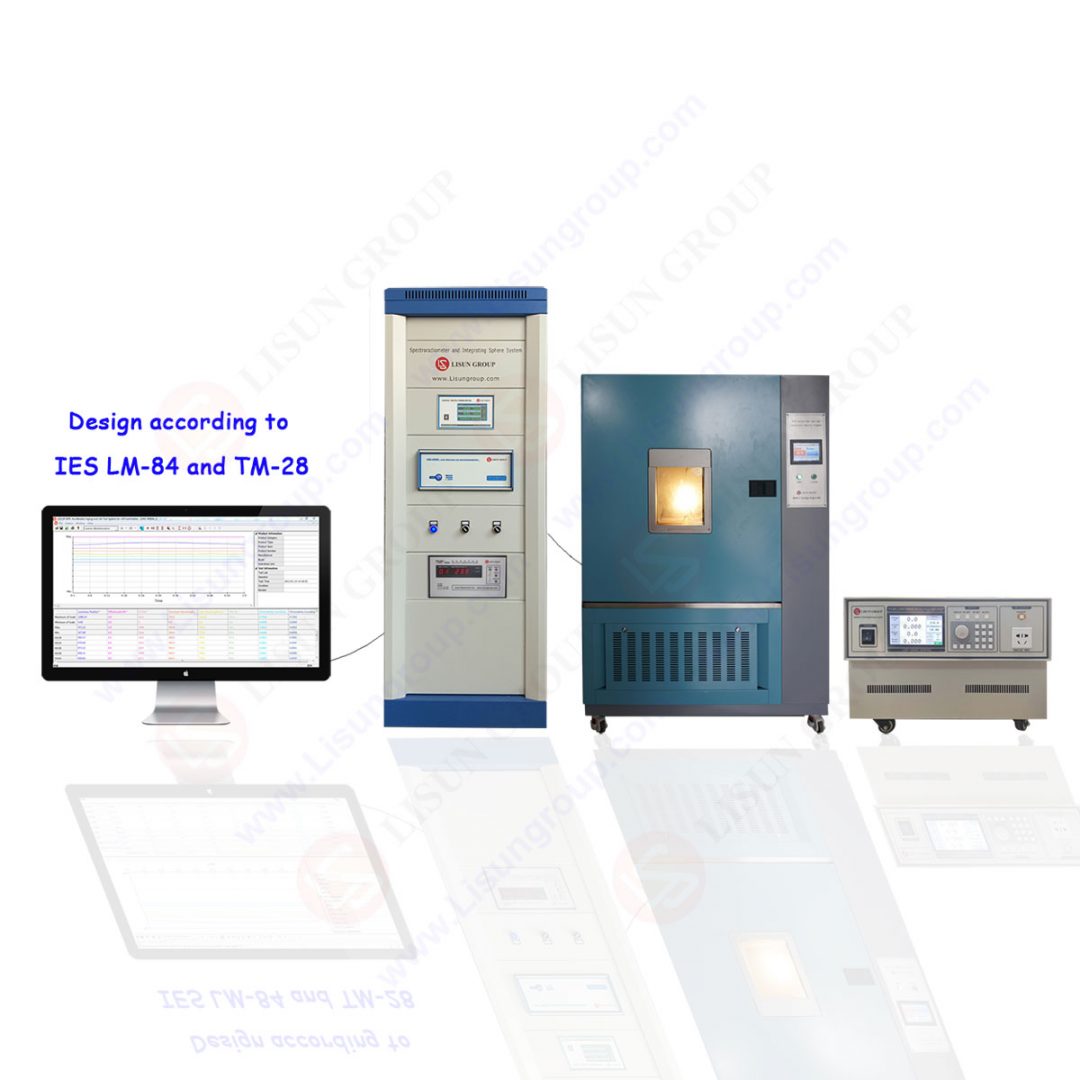
Beyond simple reporting, the Arrhenius Model integration allows for accelerated stress analysis. Engineers can input hypothetical operating temperatures (e.g., Ta = 40°C vs. 85°C) to instantly recalculate projected luminaire lifetime. This is critical for product development, as it predicts whether a component certified at 85°C will survive at 105°C application temperature. The software archives all raw spectral power distribution (SPD) data from the spectroradiometer, enabling post-hoc analysis of color shift (Δu’v’) alongside lumen maintenance.
5.1 Managing Thermal Runaway and Test Duration
One challenge with 6000-hour tests is maintaining a stable thermal interface. The system monitors the case temperature (Ts) and the ambient temperature (Ta) in real-time. If a chamber exceeds the set point by >1°C for more than 10 minutes, the test is halted and a diagnostic flag is logged. This prevents invalid data caused by thermal runaway. The system also supports “hot plugging” of failed samples—if an LED fails prematurely, its position is marked for removal without disrupting the data continuity of other samples.
5.2 Data Integrity and Audit Trail Compliance
For regulatory audits (e.g., ENERGY STAR, DLC), data traceability is mandatory. The software provides a complete audit trail, timestamping every measurement, calibration, and operator action. All raw data files are stored in a non-editable format. The system generates a comprehensive PDF report that includes the LM-80 data sheet, TM-21 projection report, and the integrating sphere measurement certificate (referencing CIE 084). This ensures that the third-party testing lab’s report meets the “Golden File” criteria required by global regulators.
6.1 Time Efficiency and Labor Costs
Manual testing with a bench setup requires an operator to physically move each sample from the aging chamber to a measurement station every 1000 hours. For a 192-sample test, this can take over 8 hours of intensive labor. The LISUN automated system performs this in situ, reducing operator involvement to less than 1 hour per week. The result is a 70-80% reduction in labor cost and the elimination of human error in sample handling.
6.2 Data Resolution and Fidelity
Manual measurement typically yields 6 data points (0, 1000, 2000, 3000, 4000, 5000, 6000 hours). The automated system can be set to log data hourly, providing over 6000 data points over the test duration. This high-resolution data is essential for identifying subtle failure mechanisms, such as early mortality or inflection points in the decay curve that a simple 6-point plot might miss. The LED Optical Aging Test Instrument: Automated L70/L50 Prediction per IES LM-80 leverages this high-fidelity data to reduce the confidence interval of the TM-21 projection.
7.1 LED Manufacturing R&D and QC
For LED chip and package manufacturers, the ability to certify product reliability at 85°C is a market entry requirement. The LEDLM-80PL allows R&D teams to iterate designs quickly. By testing four different phosphor batches simultaneously across three temperatures, the engineer can identify the most stable material within the same 6000-hour window. This accelerates time-to-market for high-power LEDs used in automotive and horticulture lighting.
7.2 Third-Party Testing Lab Operations
Independent labs must validate products for multiple clients using different standards. The dual-system variant (LEDLM-80PL/84PL) provides the flexibility to switch between LM-80 and LM-84 testing without hardware changes. The automated report generation ensures consistency across client reports. Furthermore, the system’s integration with an environmental chamber supports IES LM-80-15 Annex B testing (off-state aging), a service increasingly requested by automotive Tier 1 suppliers.
The LISUN LED Optical Aging Test Instrument: Automated L70/L50 Prediction per IES LM-80 represents a significant advancement in reliability engineering for solid-state lighting. By integrating rigorous photometric measurement standards—IES LM-79-19 for flux, CIE 127 for measurement geometry, and TM-21 for statistical projection—into a single automated platform, the system delivers a 6x improvement in data resolution over manual methods while reducing human error. The dual-system architecture (LEDLM-80PL for components, LEDLM-84PL for luminaires) ensures full compliance with the evolving regulatory landscape. For engineers seeking to validate 50,000-hour lifetimes with scientific rigor, the automated Arrhenius model software provides defensible, audit-ready data. This system is not merely a datalogger but a comprehensive reliability analysis tool that aligns perfectly with the stringent demands of the global lighting industry.
Q1: Why is the 6000-hour test duration mandatory, and what happens if my sample fails before 6000 hours?
A: The 6000-hour duration is mandated by IES LM-80-15 to establish a statistically significant dataset for the exponential decay curve regression. Under 3000 hours, the confidence interval for TM-21 projection is too wide to guarantee L70 accuracy. If a sample fails (lumen maintenance drops below 70% or fails catastrophically) before 6000 hours, the software can still project a valid L70 based on the decay rate, but the extrapolation limit (6x rule) will be reduced accordingly. The system flags early failures automatically, and the data can be used to support a claim of a shorter rated life.
Q2: Can I use this system to test LEDs based on the CIE 127 method for luminous intensity?
A: While the primary function of the LED Optical Aging Test Instrument: Automated L70/L50 Prediction per IES LM-80 is total luminous flux (lumen) measurement via an integrating sphere (per IES LM-79-19), the system can be configured with a special fixture to measure luminous intensity distribution. However, the standard LM-80/TM-21 protocol focuses on luminous flux maintenance. For specific CIE 127 intensity measurements, you would typically require a separate goniometer dedicated to intensity distribution, though the system’s standard goniophotometer mode is optimized for flux and luminance.
Q3: How does the system handle the “6x rule” for TM-21 extrapolation?
A: The TM-21-19 standard strictly limits extrapolation to 6 times the total test duration. For a standard 6000-hour test, the system will automatically cap the reported L70 prediction at 36,000 hours (approximately 4.1 years). The software will not project beyond this limit regardless of the mathematical fit. If the engineer requires a longer projection (e.g., L70 > 50,000 hours), the system must run the test for at least 8,333 hours. The software dynamically calculates this limit and displays it in the report header to prevent accidental over-claiming of product life.
Q4: What is the typical power consumption of the LEDLM-80PL system during the 6000-hour test?
A: The power consumption is dominated by the temperature chambers and the power supplies. For a three-chamber configuration running full-blast at 85°C, the total system draw is approximately 6.5 kW (including the spectrophotometer and data server). The test probes themselves draw minimal current. It is essential to connect the system to a stable regulated power supply and a backup power source (UPS) to prevent test interruption. The software automatically saves the state every 15 minutes to minimize data loss during a power failure.
Q5: Is the automated software compatible with third-party temperature chambers, or must I use LISUN chambers?
A: The LISUN software is designed to communicate with a variety of temperature chambers via standard communication protocols (USB/RS-232/GPIB). However, to ensure the tight synchronization between temperature logging and photometric measurement, we strongly recommend using LISUN’s TTC-1000 programmable chambers. Our chambers have calibrated communication ports that provide real-time case temperature (Ts) feedback directly to the measurement software, ensuring perfect correlation between temperature stress and lumen decay rate.