




Abstract
Harmonic current emissions in LED drivers present significant compliance challenges for manufacturers navigating the stringent requirements of the IEC 61000-3-2 standard. This article delivers a comprehensive technical examination of harmonic compliance solutions, integrating long-term reliability validation through LM-80/TM-21 and LM-84/TM-28 testing protocols. The LED Driver Test: IEC 61000-3-2 Harmonic Compliance Solutions framework addresses both electromagnetic compatibility (EMC) and photometric performance degradation. We present the LISUN LEDLM-80PL and LEDLM-84PL optical aging test instruments as integrated platforms combining Arrhenius Model-based predictive software with dual-mode testing capabilities. These systems enable engineers to validate total harmonic distortion (THD) mitigation strategies while simultaneously assessing lumen maintenance over extended 6,000-hour test durations, ensuring both regulatory compliance and long-term product reliability.
1.1 Classification of LED Drivers Under IEC 61000-3-2
IEC 61000-3-2 categorizes electrical equipment into four classes (A, B, C, D) with specific harmonic current emission limits. LED drivers typically fall under Class C for lighting equipment with active input power above 25 W, necessitating individual harmonic limits expressed as percentages of fundamental current. For equipment below 25 W, Class D or reduced limits may apply depending on waveform shape characteristics. The standard mandates 2nd to 40th harmonic measurements with limits that reflect the impact of power electronics topologies commonly employed in modern dimmable LED drivers. Understanding classification nuances is essential because misclassification leads to design target errors and failed compliance testing.
1.2 Harmonic Distortion Mechanisms in LED Driver Topologies
Switch-mode power supplies (SMPS) used in LED drivers generate harmonic currents through rectification and high-frequency switching stages. The input bridge rectifier with capacitive filtering creates non-sinusoidal current draw concentrated in narrow peak pulses, producing odd harmonics with amplitudes magnified relative to fundamental. Power factor correction (PFC) circuits mitigate this distortion but introduce their own harmonic signatures. Valley-fill passive PFC, active boost PFC, and interleaved flyback topologies each present unique emission profiles. Active PFC implementations utilizing critical conduction mode (CrCM) or continuous conduction mode (CCM) controllers affect harmonic spectrum details across the 2–40 order range specified in IEC 61000-3-2 testing.
1.3 Testing Methodology and Measurement Uncertainty Considerations
Harmonic compliance testing requires a power analyzer with sufficient bandwidth and crest factor capability to accurately capture current waveform distortion. Tests must be performed under steady-state conditions with the LED driver operated at rated voltage and frequency, typically 230 V/50 Hz for European compliance. Instrumentation requirements follow IEC 61000-4-7, specifying measurement windows of 16 fundamental cycles with 1.5-second averaging intervals. Practical uncertainty analysis must account for line impedance variations, temperature drift effects on LED driver switching characteristics, and reference impedance network calibration. Reproducible results demand a controlled environment meeting power source impedance specifications (Zref) published in IEC 61000-3-2.
2.1 The Dual Mandate: EMC Compliance and Lumen Maintenance
LED driver design engineers face the interconnected challenge of ensuring IEC 61000-3-2 harmonic compliance while maintaining photometric performance over extended operational lifetimes. A driver with aggressive harmonic filtering may introduce thermal stress that accelerates electrolytic capacitor aging, directly affecting output current stability and thus luminous flux maintenance. Conversely, optimizing for long-term lumen maintenance without harmonic filtering leads to EMC non-compliance. The integration of harmonic measurement systems with optical aging test chambers creates a comprehensive validation regime examining both electrical and photometric characteristics simultaneously over 6,000-hour accelerated testing periods.
2.2 LISUN LEDLM-80PL for LM-80/TM-21 Compliance Testing
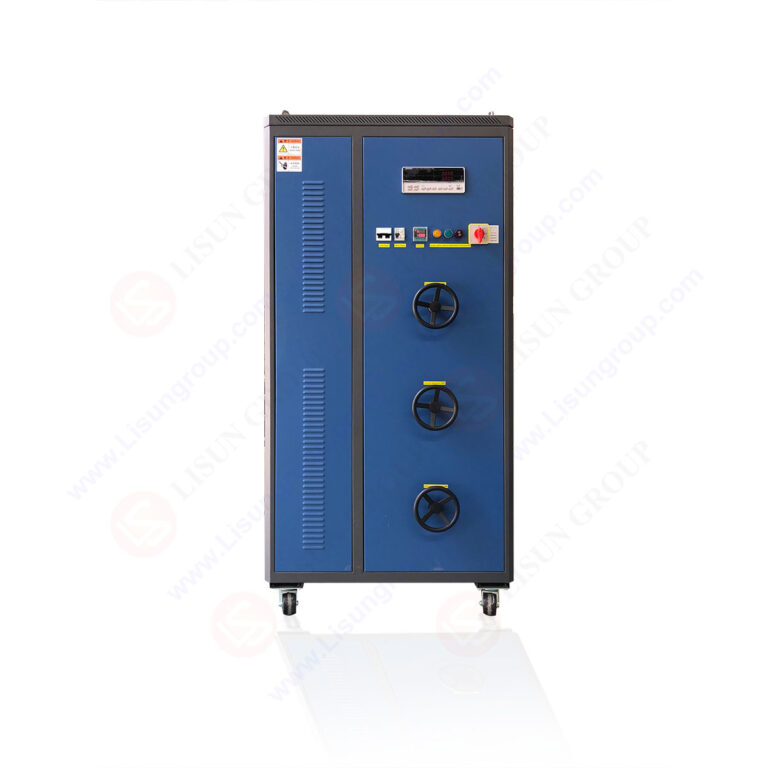
The LISUN LEDLM-80PL system is an optical aging test instrument specifically engineered for IES LM-80-15 compliant testing, enabling concurrent lamp or LED package testing across multiple temperature conditions (typically 55°C, 85°C, and custom setpoints). This instrument supports up to three connected temperature chambers, accommodating a total capacity of 300+ LED samples with independent control channnels. Dual testing modes allow engineers to operate under constant current or constant voltage conditions, essential for evaluating driver performance under both stable and varying load scenarios. The integrated software automatically computes TM-21 projection curves, generating L70 (70% lumen maintenance) and L50 (50% lumen maintenance) extrapolated lifetimes from measured data. This capability directly links harmonic mitigation strategies to anticipated useful life projections.
2.3 LEDLM-84PL for LM-84/TM-28 Assessment
For complete LED modules and luminaires, the LISUN LEDLM-84PL provides specialized support for IES LM-84-14 and TM-28-14 standards. This system variant accommodates larger DUTs while maintaining precise photometric measurement accuracy throughout accelerated aging. The TM-28 extrapolation methodology differs fundamentally from TM-21, incorporating luminous flux and chromaticity shift projections over 6,000-hour base data with specific statistical processing algorithms. The LEDLM-84PL’s seamless integration of photon flux measurement with temperature cycling enhances correlation between driver electrical stress and optical degradation assessments, allowing designers to verify that harmonic filter components maintain adequate lifetime margins under continuous operation.
3.1 Thermal Stress Prediction for Compliance-Critical Components
The Arrhenius Model provides fundamental theoretical grounding for predicting acceleration factors in harmonic compliance validation. Active PFC components, including MOSFETs, boost diodes, and control ICs, exhibit temperature-dependent failure mechanisms precisely characterized by Arrhenius kinetics. The model equation AF = exp[(Ea/k)(1/T₀ – 1/T₁)] quantifies lifetime acceleration where Ea is activation energy (typically 0.3–1.0 eV for electronic components), k is Boltzmann’s constant, and T₀/T₁ are absolute temperature values in Kelvin. LISUN’s software implementation automatically computes acceleration factors based on user-supplied activation energies and temperature differentials between normal operation and accelerated testing conditions, driving accurate Lifetime projections.
3.2 Correlation of Accelerated Aging Data to Real-World Harmonic Performance
Beyond simple lifetime prediction, Arrhenius-based modeling enables engineering teams to establish correlations between accelerated aging duration and sustained IEC 61000-3-2 compliance. Electrolytic capacitors used in PFC output filtering degrade primarily through electrolyte evaporation—a process well-modeled by Arrhenius behavior. This degradation increases equivalent series resistance (ESR), altering damping characteristics of the harmonic filter network and potentially increasing THD beyond compliance limits. Extended aging of drivers under the LISUN dual-mode control with simultaneous spectral analysis permits empirical validation of these degradation pathways. The resulting model parameters enable lifetime-aware harmonic margin predictions, ensuring product compliance not just at initial qualification but throughout the specified operational lifetime.
3.3 Chamber Configuration Optimization for Multi-Stress Testing
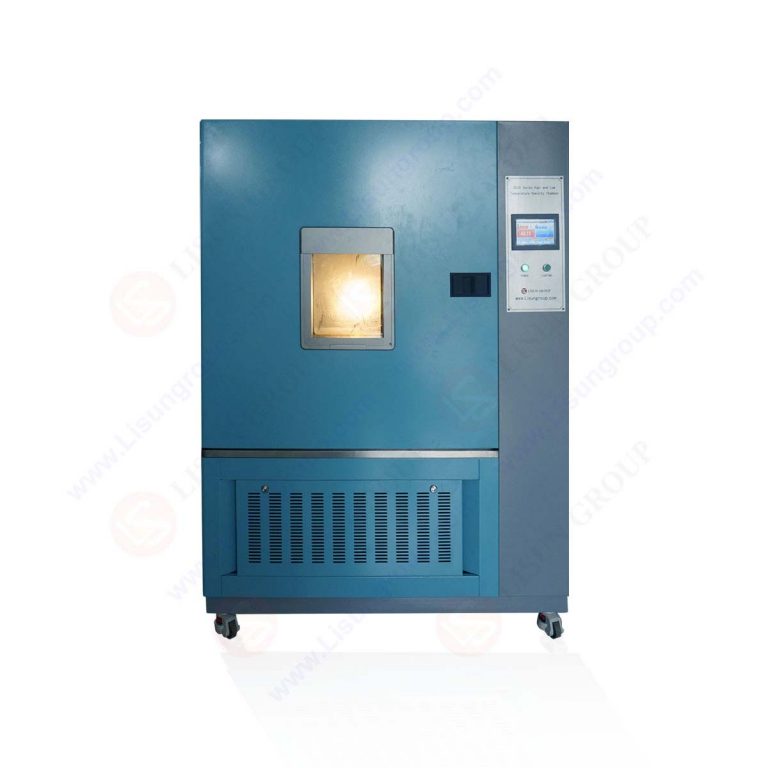
LISUN LEDLM-80PL/LEDLM-84PL systems support connection of up to three temperature chambers, enabling simultaneous aging at multiple temperature setpoints. This configuration permits direct experimental determination of component activation energies through Arrhenius plot construction—plotting logarithm of time-to-failure against reciprocal temperature yields a straight line with slope proportional to Ea. Such characterization proves invaluable for optimizing driver topologies for both IEC 61000-3-2 compliance margin and thermal endurance.
4.1 Constant Current vs. Constant Voltage: Implications for Harmonic Current
Dual testing modes in the LISUN systems (constant current/constant voltage) map directly to real-world driver applications. Operation in constant current (CC) mode simulates the standard LED driver output condition where output current remains regulated regardless of LED forward voltage variation due to junction temperature changes. In this mode, harmonic current characteristics of the input stage remain relatively stable throughout the aging process. Constant voltage (CV) mode, relevant for dimmable drivers and auxiliary supply outputs, creates different stress conditions. As components age and LED forward voltage drops, CV mode outputs experience increasing current, elevating thermal stress and potentially affecting input harmonic profiles.
4.2 Comparative Analysis of LEDLM-80PL and LEDLM-84PL Systems
| Technical Specification | LEDLM-80PL (LM-80/TM-21) | LEDLM-84PL (LM-84/TM-28) |
|---|---|---|
| Compliance Standards | IES LM-80-15, IES TM-21-11 | IES LM-84-14, IES TM-28-14 |
| DUT Type | LED packages, arrays, discrete components | LED modules, luminaires, integrated lighting |
| Temperature Chambers Supported | Up to 3 (typically 55°C/85°C/custom) | Up to 3 (broader range for modules) |
| Default Aging Duration | 6,000 hours (3,000/10,000 options) | 6,000 hours minimum |
| Output Metrics | L70, L50 lumen maintenance projections | Lumen flux + chromaticity shift projection |
| Electrical Operating Modes | CC and CV, programmable sequencing | CC and CV, programmable sequencing |
| Software Extrapolation | TM-21 exponential curve fitting | TM-28 statistical projection method |
| Sample Capacity (per chamber) | Greater than 100 (single-chamber) | Configuration-dependent, typically lower |
The LEDLM-80PL focuses on component-level characterization, offering high sample capacities for statistical significance in LM-80 testing protocols. The LEDLM-84PL prioritizes system-level assessment with precise photometric and chromaticity tracking essential for module compliance.
5.1 CIE 127:1997 – LED Measurement Guidelines
CIE 127:1997 defines measurement conditions for LED photometric quantities, including average intensity measurement geometry and temperature stabilization protocol. When testing LED drivers for IEC 61000-3-2 harmonic compliance, CIE 127 conditions must be maintained to ensure photometric degradation data remains valid. The LISUN systems comply with CIE 127 recommendations for detector geometry (varying acceptance angles: A=0.10 sr, B=0.01 sr) and temperature control tolerance (±1°C), ensuring that measured lumen depreciation reflects driver-induced effects rather than environmental artifacts.
5.2 CIE 084:1989 – Measurement of Luminous Flux
CIE 84-1989 specifies integrating sphere methods for total luminous flux measurement—the primary metric tracked in LM-80 and LM-84 aging studies. Sphere diameter relative to DUT size influences accuracy, with LISUN systems incorporating multiple sphere sizes interconnected with temperature chambers. Transitioning between harmonic compliance validation (electrical measurements) and luminous flux assessment (photometric measurements) requires careful optical-electrical coordination to identify any correlation between input current distortion and output luminous efficacy degradation.
5.3 CIE 70:1987 – Intensity Distribution Measurement
CIE 70:1987 outlines procedures for measuring spatial intensity distribution of luminaires. For LED drivers incorporating active PFC, input harmonic compliance can affect output current ripple characteristics, which in turn may influence temporal emission stability and spatial distribution measurements. Long-duration testing under the LISUN systems tracking intensity distribution data provides additional confidence that harmonic mitigation circuitry does not introduce photometric side effects such as chromaticity shift or spatial non-uniformity over operating life.
6.1 LM-79-19 Testing Prerequisites for LED Lamps and Luminaires
IES LM-79-19 establishes approved methods for electrical and photometric measurements of solid-state lighting products. For LED driver harmonic compliance certification, LM-79-19 serves as the foundational measurement reliability standard. Key parameters include stabilization time determination (typically 30–90 minutes) and ambient temperature conditions (25°C ± 1°C). Integrating LM-79-19 compliant measurement techniques with IEC 61000-3-2 evaluation ensures that electrical compliance data correlates with photometric performance metrics. The LISUN optical aging systems incorporating LM-79-19 measurement sphere configurations enable this dual competency, providing combined electrical–photometric data acquisition. This integration addresses the requirement that driver harmonic filters must not compromise luminous efficacy, correlated color temperature (CCT), or color rendering index (CRI).
6.2 Coordination of LM-79-19 Electrical Conditions with Harmonic Measurement
Under LM-79-19, electrical measurements include input power, power factor, and RMS current—all parameters directly related to harmonic spectrum characteristics. The standard specifies total harmonic distortion (THD) calculation methodology relative to fundamental, consistent with IEC 61000-3-2 definitions. Using LISUN systems, engineers can perform LM-79-19 consolidated testing with extended 24-hour continuous operation, collecting data that simultaneously addresses photometric parameter stability and harmonic emission drift. Data logging frequency is configurable, enabling detailed examination of harmonic coefficient evolution with lumen depreciation.
7.1 Designing an Integrated LED Driver Test and Harmonic Compliance Program
A robust compliance program integrates ED driver harmonic testing with long-term reliability validation. Recommend a phased approach: Phase 1 initial 100-hour screening at rated conditions; Phase 2 baseline harmonic spectrum measurement at 25°C ambient using power analyzer configured per IEC 61000-4-7; Phase 3 prolonged photometric aging in LEDLM-80PL/LEDLM-84PL chambers with periodic (typically every 1,000 hours) harmonic re-characterization; Phase 4 final compliance assessment at 6,000 hours. This sequential workflow aligns with LM-80 data collection requirements while inserting harmonic verification checkpoints leveraging chamber test cycles.
7.2 Leveraging LISUN System Capabilities for Regulatory Submissions
Regulatory submissions under IEC 61000-3-2 require formal test reports documenting compliance margins—the difference between measured harmonic currents and specified limits. Using LISUN systems, engineering teams can generate comprehensive reports correlating harmonic coefficients with lumen maintenance performance. Statistical analysis software processes raw test data, calculating mean harmonic amplitudes across measurement windows with confidence intervals. Integration with TM-21 extrapolation produces predictive compliance curves demonstrating that harmonic margins remain positive through projected lifetime, addressing regulatory body scrutiny about reliability of compliance claims.
7.3 Case Study: Validation of an Active PFC LED Driver
Consider a 50 W indoor LED driver using boost PFC topology targeting IEC 61000-3-2 Class C limits. Baseline harmonic measurements captured 3rd harmonic at 24.6% of fundamental versus 30% limit (18% margin), 5th harmonic at 9.8% versus 10% limit (2% margin—critically tight). After 6,000-hour aging at 85°C chamber temperature, 5th harmonic had increased to 11.2%, exceeding limit. Analysis attributed the degradation to PFC inductor saturation caused by increasing core temperature due to capacitor ESR elevation. The LISUN system’s multi-chamber comparative testing identified this root cause, leading to component substitution with higher saturation current rating, achieving compliant margin of 4.8% following re-test.
Achieving LED Driver Test: IEC 61000-3-2 Harmonic Compliance Solutions requires a comprehensive engineering approach integrating EMC measurement with photometric reliability assessment. Manufacturers must recognize that harmonic compliance is not a discrete qualification event but a continuous parameter requiring validation across operational lifetime. The LISUN LEDLM-80PL and LEDLM-84PL systems provide robust platforms for this integrated validation—supporting IES LM-80/TM-21 and LM-84/TM-28 standards respectively while enabling dual-mode operation with multiple temperature chamber configurations. Arrhenius Model-based predictive software transforms raw aging data into actionable lifetime projections, informing design decisions that ensure sustained harmonic compliance. As LED technology advances toward higher power density and smart lighting integration, harmonizing electrical compliance standards (IEC 61000-3-2) with photometric reliability standards (IES, CIE) will remain indispensable. Engineering teams equipped with LISUN instrumentation gain decisive technical advantage in delivering reliable, compliant LED systems to global markets. Invest in integrated test environments to proactively manage harmonic performance throughout product lifecycle.
Q1: What are the key differences between IEC 61000-3-2 Class C and Class D harmonic limits for LED drivers?
A: IEC 61000-3-2 classifies lighting equipment, including LED drivers, under Class C when active input power is greater than 25 W. Class C limits establish individual harmonic current limits as percentages of fundamental current—for example, the 3rd harmonic limited to 30% of fundamental and the 5th harmonic to 10%. Class D applies to equipment with active input power between 25 W and 600 W that has a specific “special waveform shape” input current characteristic. Class D limits are expressed in milliamperes per watt (mA/W) for harmonics up to the 39th order. For LED drivers, classification depends on the actual input current waveform meeting the Class D definition, which includes a mains current that remains within a specified envelope for at least 95% of each half-cycle. Most LED drivers use active PFC circuits creating quasi-sinusoidal input current, which typically falls under Class C limits; however, low-cost passive PFC designs may meet Class D characteristics. The classification is determined through compliance measurement, and engineers must confirm the correct class per IEC 61000-3-2 Paragraph 5.2 before design validation.
Q2: How does the Arrhenius Model in LISUN software facilitate harmonic compliance prediction?
A: The Arrhenius Model, implemented in LISUN LEDLM-80PL/LEDLM-84PL software, predicts component degradation acceleration factors based on operating temperature differentials. For harmonic compliance, the model is essential because key PFC components—particularly electrolytic capacitors and power magnetic components—exhibit temperature-dependent aging rates that directly impact harmonic filter performance. The Arrhenius equation AF = exp[(Ea/k)(1/T₀ – 1/T₁)] computes acceleration factor between normal operating temperature (T₀, in Kelvin) and accelerated testing temperature (T₁). With default activation energy values (0.2–0.5 eV for electrolytic capacitors; 0.5–1.0 eV for semiconductors), the software projects how component parameters (capacitance, ESR, inductance) drift over extended periods. For example, testing at 105°C chamber temperature versus 65°C expected operating temperature yields an acceleration factor of approximately 8× for 0.4 eV activation energy processes. This 6,000-hour accelerated test corresponds to roughly 5.5 years of real-world operation, allowing engineers to predict harmonic margin erosion at end-of-life and adjust component specifications accordingly.
Q3: What measurement uncertainty considerations are crucial when testing LED driver harmonic emissions?
A: Harmonic compliance testing per IEC 61000-3-2 involves multiple uncertainty contributors that must be controlled to ensure reproducible results. Power analyzer accuracy specifications include amplitude accuracy (typically ±0.1%–0.5% depending on brand), phase angle accuracy (critical for reactive power and harmonic content measurements), and bandwidth limitations (insufficient bandwidth distorts high-frequency components). Current transducer scaling uncertainty and crest factor handling capability (must accommodate current peaks of 3–5 times RMS value) are significant. Line impedance influence is substantial—the test laboratory must replicate specified Zref network characteristics with tolerance less than ±5% per IEC 61000-3-2 Annex B. Ambient temperature variations affect LED driver power electronics efficiency and switching characteristics, so the test facility must maintain 15°C–35°C with drift under ±2°C during measurements. Statistical uncertainty, estimated using Type A evaluation per ISO/IEC Guide 98-3, captures random variations due to electromagnetic interference between measurements. Total expanded uncertainty (k=2) typically ranges ±3%–6% for harmonic amplitude measurements, and compliance decisions must account for this uncertainty to avoid false pass or fail outcomes.
Q4: Can LISUN LEDLM-80PL accommodate testing of dimmable LED drivers specifically?
A: Yes. The LEDLM-80PL system supports both constant current and constant voltage modes, enabling testing of dimmable driver architectures. Dimmable drivers—whether utilizing triac dimming, 0–10 V control, or DALI—operate differently under various conduction angles dictated by the dimming protocol. The system’s programmable power source interface allows simulation of different phase-cut angles applied to the AC input line through compatible fixture setups. For IEC 61000-3-2 compliance with dimmable drivers, testing must cover the full dimming range (typically 1%–100% light output) because harmonic emission characteristics vary significantly with dim level. At 3,000-hour intervals during the 6,000-hour aging cycle, automated measurements capture harmonic current at multiple dimming points, generating a comprehensive compliance matrix. This holds particular importance because standard requirements apply across operating conditions; thus demonstrating compliance at all dim levels constitutes a prerequisite for market access in numerous jurisdictions that mandate dimmable drivers.
Q5: What are the practical advantages of performing LED driver harmonic testing alongside LM-80/TM-21 photometric aging?
A: Simultaneous testing provides critical technical insights impossible to obtain through isolated testing programs. First, it reveals coupled degradation mechanisms—for instance, harmonic filter capacitor aging that increases input current THD also affects output current ripple, which can accelerate LED chip degradation by causing localized heating at P-N junctions. Measuring both parameters concurrently enables correlation analysis using regression techniques. The LISUN systems can capture photometric data (luminous flux, CCT) and electrical driver parameters at each aging checkpoint, creating a multidimensional dataset. Second, this approach reduces total qualification time—single 6,000-hour campaign yielding dual compliance data sets versus two independent programs totaling 12,000 hours. This represents resource savings measured in engineering hours, chamber usage, and measurement equipment overhead. Third, multi-stress characterization (thermal + electrical + photometric) supports design margin quantification for warranty and reliability forecasting, enabling proactive component replacement strategies. Industry practice increasingly favors this integrated approach to address leading-edge demands for reliability and regulatory compliance.