




Abstract
In the realm of industrial manufacturing, the quantification of color is a critical parameter for quality assurance, brand consistency, and product acceptance. ISO 7724 provides the foundational framework for colorimetry, outlining the requirements for instruments and measurement geometries used to evaluate paint and related materials. This article examines the LISUN HSCD series portable spectrophotometers, specifically the HSCD-780, HSCD-800, and HSCD-860 models, in the context of ISO 7724 and other international standards. By integrating advanced grating spectroscopy, dual-beam optics, and robust calibration systems, these instruments deliver laboratory-grade accuracy in a portable format. The discussion covers core optical technologies, comparative model specifications, industry-specific applications, and practical strategies for integrating these devices into existing quality control workflows to mitigate metamerism and ensure color consistency across diverse production environments.
1.1 The Scope and Structure of ISO 7724 Standards
ISO 7724, a multi-part standard dedicated to colorimetry of paints and varnishes, establishes the fundamental terminology, measurement conditions, and calculation principles necessary for objective color communication. The standard’s architecture, specifically parts detailing general principles and measurement procedures, dictates that instruments must provide a defined illumination and viewing geometry, typically 45°/0° or d/8° (diffuse/8°), to ensure repeatable and comparable readings. For QA professionals, adherence to ISO 7724 is not just a procedural formality; it is a guarantee that color data is consistent across different instruments, laboratories, and timeframes. The LISUN HSCD series is engineered to conform to these strict geometric and spectral requirements, ensuring that deviation values (dE*ab) are meaningful and actionable. This alignment provides a universal language for specifying tolerances with suppliers and validating the quality of incoming raw materials and outgoing finished goods.
1.2 The Criticality of Instrument Geometry and Illumination
The selection of measurement geometry, as defined by ISO 7724, profoundly influences the perceived color, particularly for materials with surface texture or gloss variation. The HSCD series utilizes the diffuse/8° (d/8°) integrating sphere geometry, which is the most versatile and widely adopted configuration for industrial applications. This geometry captures the total reflected light (specular included, SCI) or only the diffuse component (specular excluded, SCE), providing critical insight into both true color and surface appearance. By incorporating both SCI and SCE modes, the spectrophotometer allows operators to distinguish between a batch failing due to pigmentation errors versus one failing due to surface finish differences. This dual capability is essential for troubleshooting production line variability and is a core reason why d/8° instruments are preferred in environments testing materials as diverse as matte textiles, glossy automotive coatings, and textured plastics.
1.3 Standardizing Measurement Conditions for Global Consistency
Beyond geometry, ISO 7724 emphasizes the importance of standardized illuminants (e.g., D65 for daylight) and observer functions (2° and 10°) for calculating colorimetric values. The HSCD series offers a comprehensive suite of illuminants including D65, A, C, D50, and F2, allowing laboratories to simulate different lighting conditions (e.g., storefront halogen vs. outdoor daylight) to predict visual acceptance. Measurement repeatability is fundamental; a high-performance instrument must produce identical values for the same sample under identical conditions. LISUN achieves this through a combination of a stabilized xenon lamp (or LED, per model) and a precise spectral analysis engine. This ensures that color differences attributed to a production process change are real and not artifacts of instrument drift or illumination instability, solidifying the instrument’s utility in qualifying products against stringent buyer specifications.
2.1 Grating Spectroscopy vs. Filter-Based Technology
The path to accurate color data reliability begins with how the instrument separates light into its spectral components. Traditional filter-based instruments use a series of optical filters to measure a limited number of color bands, which can lead to inaccuracies in metamerism prediction and for colors with complex spectral reflectance curves. In contrast, the LISUN HSCD series employs a high-performance diffraction grating that disperses the full spectrum of visible light across a high-resolution sensor array. This grating spectroscopy technique enables the capture of detailed spectral reflectance data at regular intervals across the visible range (typically 400-700nm). This detailed data is essential for calculating color under any illuminant, providing superior accuracy in color matching and allowing for the calculation of color strength and opacity—critical functions for R&D and formulation departments where metameric pairs must be identified.
2.2 The Advantages of a Dual-Beam Optical System
To counteract the effects of temperature fluctuations and lamp intensity drift on measurement accuracy, the HSCD series integrates a dual-beam optical system architecture. In this design, light from the source is split into two paths: one directed towards the sample and the other towards an internal reference sensor. The instrument continuously monitors the reference beam, correcting the sample reading in real-time for any source variations. This sophisticated optical feedback loop ensures long-term stability and measurement repeatability that, for the top-tier models, achieves a dE*ab repeatability of within 0.03-0.04. For quality control managers, the dual-beam system translates into fewer recalibrations, higher confidence in data integrity during extended production runs, and a significant reduction in error variance between instruments on the factory floor.
2.3 Innovations in Nano-Integrated Optical Devices
LISUN’s investment in nano-integrated optical device technology has resulted in a more compact optical bench without compromising on optical path length or signal-to-noise ratio. By miniaturizing the grating and lens systems through nano-precision manufacturing, the HSCD series achieves a stable optical platform that is highly resistant to shock and vibration—a common issue in portable instruments used near machinery. This robustness ensures that the calibration and alignment remain consistent despite the rigors of daily transport and use, a key differentiator for third-party testing facilities and field-based QA audits. The compact design also facilitates the integration of a larger integrating sphere for the HSCD-860 model, allowing it to handle larger sample areas and inhomogeneous materials more effectively, providing more representative average color readings.
3.1 Key Parameters of the HSCD Series Portfolio
The HSCD series offers a range of models designed to balance performance and cost across different application needs. The portfolio addresses the variance in user requirements, from basic pass/fail quality checks to complex formulation and research tasks. The primary differences lie in measurement repeatability, aperture size, and source type, which directly influence suitability for textured or uniform materials.
| Feature/Parameter | HSCD-780 | HSCD-800 | HSCD-860 |
|---|---|---|---|
| Measurement Geometry | d/8° (SCI & SCE) | d/8° (SCI & SCE) | d/8° (SCI & SCE) |
| Light Source Type | LED (High Energy) | Long-life Xenon Lamp | Long-life Xenon Lamp |
| Aperture Options (MAV: Φmm/LAV: Φmm) | Single: Φ8 / Φ10 | Dual: Φ8 (MAV) / Φ25 (LAV) | Single: Φ25 (LAV) |
| Measurement Repeatability (White Board) | Within dE*ab ≤ 0.05 | Within dE*ab ≤ 0.04 | Within dE*ab ≤ 0.03 |
| *Inter-Instrument Agreement (dEab)** | Within 0.20 | Within 0.16 | Within 0.13 |
| Spectral Range / Wavelength Interval | 400-700nm / 10nm | 400-700nm / 10nm | 400-700nm / 10nm |
| Standard Viewing Angles | 2° & 10° | 2° & 10° | 2° & 10° |
| Connectivity | USB, Bluetooth BT | USB, Bluetooth BT | USB, Bluetooth BT, WiFi |
| Display & Battery | Full-Color Touch Screen / Rechargeable Li-ion | Full-Color Touch Screen / Rechargeable Li-ion | Full-Color Touch Screen / High-Capacity Li-ion |
3.2 Analyzing Performance Metrics in Practical Use
The selection between the HSCD-780 and HSCD-860 involves a trade-off between versatility and precision. The HSCD-780, utilizing LED technology, provides a balance of energy efficiency and stable output, making it ideal for high-volume routine checks where portability and battery life are critical. Its 8mm aperture is suitable for most plastic, coating, and textile applications. Conversely, the HSCD-860, with its larger Φ25.4mm aperture, is specifically designed to measure non-homogeneous materials like molded composites, textured fabrics, or food products where a large area average is essential for meaningful data. The xenon lamp in the HSCD-860 and HSCD-800 offers a high-intensity, continuous spectrum, which is superior for detecting fluorescence in papers and textiles where optical brightening agents (OBAs) are present. The inter-instrument agreement of 0.13 for the HSCD-860 is a critical metric for global corporations managing multiple sites, ensuring that a color approved in Italy is verified to the same tolerance in China, streamlining global production workflows.
4.1 Zirconium Calibration Whiteboard Technology
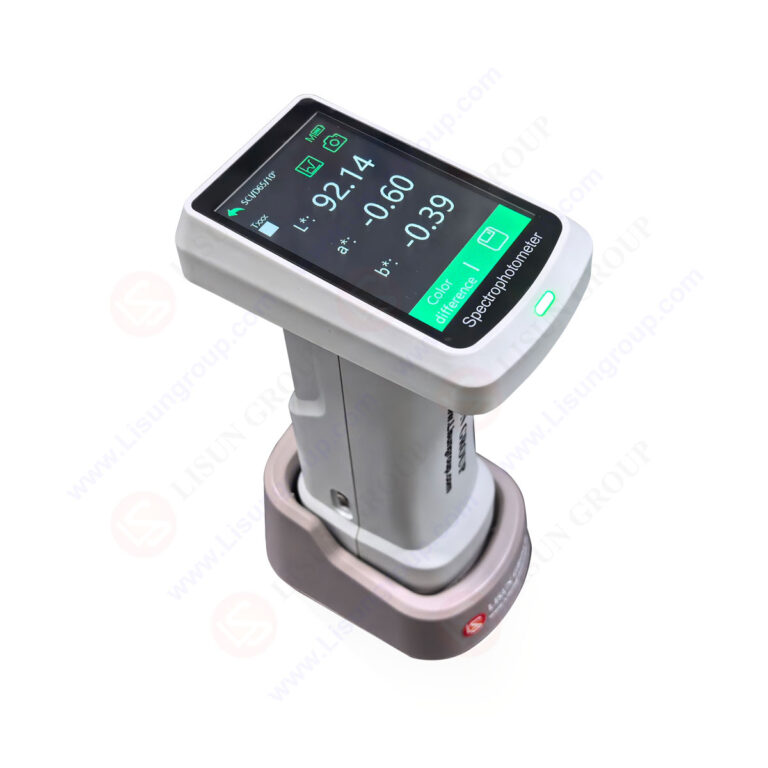
Calibration is the bedrock of reliable color measurement. LISUN addresses this with a proprietary zirconium (ZrO2) calibration whiteboard, a ceramic-based standard that offers superior mechanical hardness and chemical stability compared to traditional barium sulfate or PTFE (polytetrafluoroethylene) plates. This zirconium-based whiteboard is less prone to yellowing, optical damage, or staining from environmental contaminants, ensuring a stable reference point for the instrument’s 100% reflectance baseline. The inherent stability of the zirconium material reduces the frequency and need for traceable external recalibration, offering a high level of confidence to laboratory technicians. This robust standard ensures that the white calibration remains true over the instrument’s lifespan, preserving the accuracy of the data and ensuring that calculations against customer-supplied standards, such as color chips or master batches, maintain their integrity over time.
4.2 Alignment with Global Standards (ASTM E1164, GB/T 3978, DIN5033)
The HSCD series’ compliance with a suite of international standards ensures universal acceptance. Its spectral data acquisition adheres to ASTM E1164, the standard practice for obtaining spectrophotometric data for object-color evaluation, which specifies the geometric and spectral conditions that the HSCD meets. This standard alignment is crucial for the textile and coatings industries where ASTM is the common denominator. Simultaneously, the instrument’s calculations are fully compliant with CIE No.15 and GB/T 3978, the latter being the Chinese standard specifying standard illuminants and geometric conditions. For German market manufacturers, compliance with DIN5033 Teil7 ensures the standard colorimetric procedures are followed, allowing for the direct comparison of data with European partners. This multi-standard conformance eliminates the need for data conversion and allows users to report results directly in the color spaces and indices (e.g., CIE Lab, CIE Luv, CIE XYZ) favored by their specific client base.
5.1 Whiteness and Yellowness Index Calculation (ISO 2470, ASTM E313, ASTM D1925)
For industries producing paper, plastics, and white textiles, the measurement of whiteness is a key commercial metric. The HSCD series calculates Whiteness Index (WI) according to various methods including the ISO 2470 standard (for paper) and the widely used ASTM E313 formula. Simultaneously, Yellowness Index (YI) is computed as per ASTM D1925 and ASTM E313, providing insight into the degradation or contamination of materials over time or due to UV exposure. The ability to switch between these indices (including CIE whiteness) is vital for formulators. A shift in YI can indicate oxidation or improper polymerization, allowing for early intervention in the production process. The comprehensive software suite included with the HSCD series allows for the trend analysis of these indices over time, enabling predictive maintenance and quality trending.
5.2 Evaluating Metamerism and Color Difference
Metamerism remains one of the most challenging occurrences in color management, where two materials match under one light source but diverge under another. The high spectral resolution of HSCD series instruments is essential for quantifying the Metamerism Index (MI). By analyzing the entire spectral reflectance curve, the software can predict mismatches under different illuminants (e.g., D65 vs. Illuminant A), allowing R&D chemists to reformulate materials early in the development phase. The series supports standard color difference formulas including dEab, dEcmc, dE94, and dE00 (CIEDE2000). The inclusion of CIEDE2000 is particularly beneficial as it provides a more visually uniform color tolerance system, improving the correlation between calculated color difference and human visual perception for color-critical applications like automotive interiors and high-end appliances.
6.1 Paint, Coatings, and Plastics: Formulation and Batch Consistency
In the paint industry, achieving a perfect match to a master standard is a primary challenge. The HSCD series allows formulators to use the color matching software to build a database of pigments and dyes. Using the spectral data from the instrument, the software can generate recipes with predicted dE* values, significantly reducing trial-and-error experiments. On the production line, the dual SCI/SCE mode is critical for controlling both pigment load and surface texture. For example, a change in casting or molding temperature in plastics may alter the surface glide without changing the pigment; the SCE mode will detect this, alerting the QC manager to a processing issue rather than a material issue. This level of diagnostic insight ensures that corrections are applied at the root cause, improving production efficiency.
6.2 Textiles, Food, and Appliance: Addressing Specialized Needs
The food industry faces unique challenges due to sample shape and texture. The large measurement aperture of the HSCD-860 allows for a more representative average color reading of granular or irregular surfaces, such as baked goods or snack foods. For textiles, the HSCD series assists in verifying dye lot consistency. Combined with the ISO 2470 whiteness index, textile manufacturers can accurately control the amount of optical brightening agent applied to fabrics, ensuring a bright, consistent white. In appliances and automotive interiors, the focus is on aesthetics and durability. The HSCD series aids in matching the color of plastics, paints, and leathers to within a tolerance that assures visual harmony across different materials. The included UV component in the xenon source is vital here to ensure that UV-absorbing pigments are accounted for, preventing apparent color mismatches in sunlight.
7.1 Seamless Data Connectivity and Reporting
Modern manufacturing requires traceable data systems. The HSCD series is equipped with standard connectivity options such as USB and Bluetooth (and WiFi on the HSCD-860). This enables seamless integration with Quality Management Systems (QMS) and statistical process control (SPC) software. Operators can directly transmit measurement data to a central database, eliminating transcription errors. The accompanying PC software facilitates the generation of detailed quality reports, including spectral curves, color space diagrams, and trend charts. This digital documentation supports compliance with audit requirements like IATF 16949 in automotive or ISO 9001 across all sectors, providing undeniable evidence of quality control adherence over time.
7.2 Software Capabilities for R&D and QA
During production, the ability to set pass/fail tolerances is performed on the instrument itself, providing immediate and clear indicators. However, the software extends this capability by allowing pre-programmed measurement templates for specific products or materials. For R&D, the software supports proprietary color formulas and allows for batch versus standard comparisons with full statistical analysis, including standard deviation and mean dE calculations. The ability to store thousands of standards and batches in the instrument’s memory allows for deep on-site analysis without needing a computer nearby. This combination of standalone robustness and software depth makes the HSCD series a flexible hub for all color management activities, from component verification at a supplier’s site to final assembly quality checks.
The LISUN HSCD series portable spectrophotometers represent a sophisticated solution for color measurement challenges aligned with ISO 7724 and related international standards. Through the adoption of grating spectroscopy and a dual-beam optical system, these instruments offer superior accuracy and repeatability, addressing the technical nuances of metamerism and measurement geometry. The use of a zirconium whiteboard enhances long-term calibration stability, translating into sustained data integrity for laboratory and production environments. The clear model differentiation within the series—from the agile HSCD-780 to the robust, large-aperture HSCD-860—demonstrates a strategic understanding of diverse industrial needs. Ultimately, the series provides QC managers and lab technicians with the confidence to make data-driven decisions, ensuring that products meet the exacting visual and durability standards of consumers, thereby solidifying brand integrity and reducing operational waste.
Q1: What is the practical difference between SCI and SCE data in the context of ISO 7724?
A: SCI (Specular Component Included) and SCE (Specular Component Excluded) refer to how the instrument handles the glossy highlight reflected from a surface. Under ISO 7724 and the d/8° geometry, SCI measurements are considered to represent the “true” color independent of surface gloss, as it includes the total reflected light. This is often preferred for color matching and formulation control. SCE measurements, conversely, exclude the gloss factor, providing data that represents the color as seen by the human eye, which is influenced by surface texture. In quality control, comparing both readings can be highly diagnostic; if the color fails assessment under SCE but passes under SCI, the issue is likely due to a difference in surface topology or gloss rather than a pigment or pigment concentration error.
*Q2: How does the HSCD series utilize multiple color difference formulas like dEab and CIEDE2000?*
A: The software integrated into the HSCD series allows users to select the most appropriate tolerance metric for their application. The standard, and most legacy, dEab (CIE 1976) calculates Euclidean distance in the Lab color space; however, this space is not visually uniform for all colors. For industries where color perception is critical, such as automotive or cosmetics, the instrument offers the CIEDE2000 (dE00) formula. This advanced metric incorporates weighting factors for lightness, chroma, and hue, providing a quantitative value that most accurately correlates to human vision’s perceptual sensitivity. It also offers dEcmc and dE94, allowing technical teams to match the exact tolerance metric demanded by their customer contracts. This flexibility enables more consistent pass/fail decisions and better communication regarding color quality.
Q3: Why is a grating-based spectrophotometer more accurate than a filter-based one for measuring metamerism?
A: Metamerism is caused when two specimens reflect different amounts of light at specific wavelengths but visually match under a standard illuminant. A filter-based instrument (also sometimes called colorimeter) measures color using a limited set of broadband filters (typically 3-6), which mimics human eye response. This method averages the spectral data, potentially masking sharp differences in spectral reflectance curves that cause metamerism. A grating-based spectrophotometer, like the HSCD series, divides the visible light into discrete wavelength bands (often 10nm or finer), effectively mapping the entire spectral reflectance curve of the sample. This rich, detailed data allows the software to calculate the spectral mismatch, providing an objective Metamerism Index (MI) that predicts when the samples will diverge in color under different lighting conditions. It provides data that a simple colorimeter mathematically cannot, allowing formulators to correct it.
Q4: What is the significance of the zirconium calibration whiteboard compared to standard white tiles?
A: The calibration standard is the linchpin of measurement accuracy; if it degrades, all subsequent measurements are faulty. Traditional standards, like those made of barium sulfate or PTFE, are highly reflective but are prone to contamination, yellowing over time, and are relatively soft, making them susceptible to scratches. LISUN’s use of a zirconium-based whiteboard addresses these limitations. Zirconium is a ceramic material that is exceptionally hard, offering high resistance to scratches and physical wear. More importantly, it demonstrates excellent optical stability, resisting UV degradation and oxidation, which can cause the standard to yellow and lose its “whiteness.” This translates to a more stable baseline over the instrument’s lifespan, ensuring that the spectral reflectance endpoints remain constant, achieving the specified inter-instrument agreement and long-term repeatability, and reducing downtime associated with frequent recalibrations.