


Here is the comprehensive technical article generated according to your specifications.
Abstract
For LED manufacturers and testing laboratories, ensuring long-term reliability under environmental stress is paramount. This article explores how the Climate Test Equipment | LISUN IEC 60068 Temperature Humidity Chamber integrates with the LISUN LEDLM-80PL/84PL Optical Aging Test Instruments to provide a complete solution for accelerated aging validation. By combining dual-system architecture (IES LM-80/TM-21 and LM-84/TM-28) with the Arrhenius Model-based software, engineers can accurately predict L70/L50 metrics from 6000-hour test data. This technical guide focuses on system architecture, standard compliance, and practical applications for lumen maintenance testing in controlled climatic conditions.
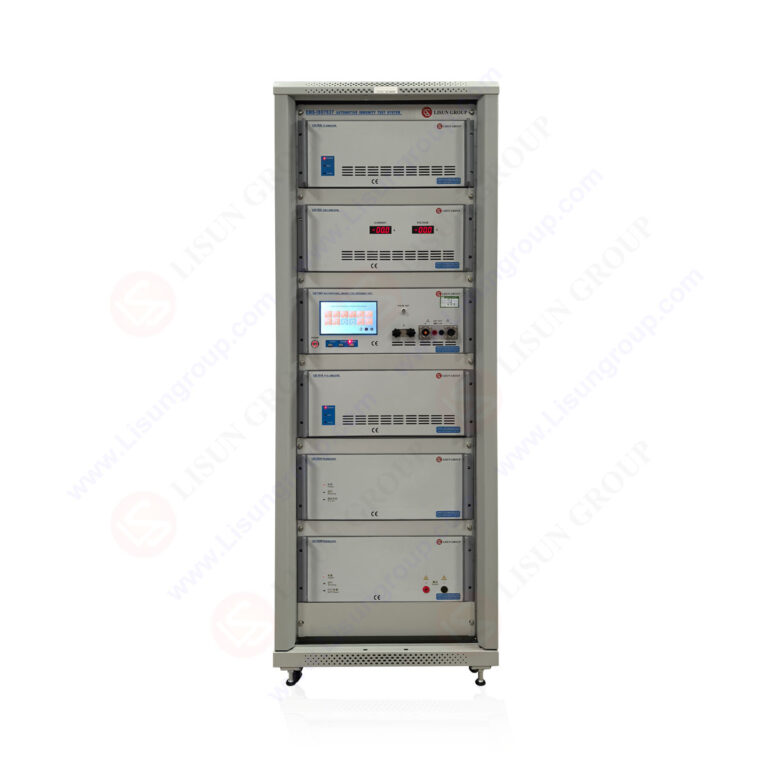
The foundation of accurate photometric aging testing lies in the seamless integration of the environmental chamber with the measurement system. The Climate Test Equipment | LISUN IEC 60068 Temperature Humidity Chamber is designed to create stable, repeatable conditions (typically 25°C/65%RH for LM-80, or elevated temperatures up to 85°C/85%RH for accelerated tests) while the LEDLM system monitors optical decay.
1.1 Dual System Operation: LEDLM-80PL vs. LEDLM-84PL
The LISUN platform offers two distinct hardware configurations tailored to different industry standards. The LEDLM-80PL is configured for compliance with IES LM-80-15 and TM-21-19, primarily used for mid-power and high-power LEDs with test durations lasting up to 6000 hours or more. Conversely, the LEDLM-84PL is optimized for LM-84-19 and TM-28-19, which is often applied to LED lamps, engines, and modules requiring different mounting and measurement geometries. The IEC 60068 chamber provides the necessary thermal and humidity stress for both variants.
1.2 Hardware Customization and Chamber Connectivity
A key technical advantage is the system’s ability to support up to 3 connected temperature chambers simultaneously. This allows for parallel testing at different stress levels (e.g., 55°C, 85°C, and a control at 25°C) as required by the Arrhenius Model for activation energy derivation.
- Data Acquisition: The system utilizes high-speed DAQ modules to log forward voltage ((V_f)), current, and case temperature ((T_c)) every 0.1 seconds.
- Sample Capacity: A single chamber can accommodate multiple LEDs or modules on temperature-controlled plates, ensuring the case temperature remains within ±1°C of the set point.
Compliance with the IES and CIE standards is non-negotiable for credible LED reliability data. The LISUN system is pre-programmed to enforce the test protocols required by these standards.
2.1 IES LM-80-15 and TM-21-19 Extrapolation
The gold standard for LED lumen maintenance is IES LM-80, which mandates photometric measurements at specific intervals (e.g., 0, 1000, 3000, 6000 hours) at multiple temperatures. The LISUN software automatically calculates the L70 (time to 70% lumen output) using the Arrhenius Model. TM-21-19 extrapolation is then applied to project the lumen maintenance lifetime, with the software flagging any data sets that do not meet the 0.9 R² correlation coefficient for the exponential decay fit.
2.2 Integration of IES LM-79-19 and CIE 127
While LM-80 focuses on lumen depreciation, the system also supports IES LM-79-19 for total flux measurement and CIE 127 for spatial intensity distribution. The integrating sphere (a core component of the LEDLM system) measures total luminous flux, correlated color temperature (CCT), and color rendering index (CRI) at each test interval. This holistic approach ensures that color shift over time is also captured, not just luminosity decay.
The core intelligence of the LISUN system lies in its embedded Arrhenius Model-based software. This transforms raw photometric data into actionable lifetime predictions, a critical step for warranty validation.
3.1 Activation Energy Calculation and Test Durations
The Arrhenius equation, (L(t) = A e^{(-E_a / kT)}), is used to accelerate the failure mechanism. The software utilizes data from the 6000-hour test at three case temperatures to calculate the activation energy ((E_a)) specific to the LED under test. A typical (E_a) for LED phosphor degradation is 0.4 eV to 0.7 eV. The system automatically computes the L70 and L50 (time to 50% lumen output) lifetimes.
3.2 Dual Testing Modes: Steady-State vs. Cyclical
To address different environmental stress profiles, the system offers two testing modes within the IEC 60068 chamber:
- Mode A (Steady-State): Constant temperature and humidity (e.g., 85°C/85%RH) for baseline degradation analysis.
- Mode B (Cyclical): Temperature ramping and humidity cycling (e.g., 25°C to 85°C over 60 minutes) to simulate thermal shock effects on solder joints. The software records the recovery time of photometric values after each cycle.
Understanding the limits and capabilities of the measurement system is crucial for accurate data interpretation. Below is a comparative table of the two primary system variants.
Table 1: Comparative Specifications of LISUN LEDLM-80PL and LEDLM-84PL Systems
| Parameter | LEDLM-80PL (LM-80 Focus) | LEDLM-84PL (LM-84 Focus) |
|---|---|---|
| Primary Standard | IES LM-80-15, TM-21-19 | IES LM-84-19, TM-28-19 |
| Test Object Size | Individual LEDs (e.g., 5050, 3030) | LED Modules & Lamps (up to Ø300mm) |
| Lumen Measurement | Integrating Sphere (Sci-Spec) | Spectroradiometer + Sphere |
| Temperature Channels | 20 (T-type thermocouple) | 32 (T-type thermocouple) |
| Max Chamber Support | 3 simultaneous chambers | 2 simultaneous chambers |
| L70/L50 Calculation | Arrhenius + Exponential Fit | Arrhenius + Exponential Fit |
| Data Sample Rate | 1 read per 0.1 seconds | 1 read per 1 second |
4.1 Data Reporting and Analysis Software

The software generates standardized reports that include raw data sheets, TM-21 projection curves, and residual plots. It automatically flags outliers using Chauvenet’s criterion, ensuring statistical integrity. All data is logged in a SQL database, allowing for historical trend analysis across different production batches.
4.2 Current and Voltage Stability
To prevent secondary failure modes, the system employs a precision DC power supply with ripple below 1 mV. The forward current is maintained within ±0.1% of the set point (e.g., 350 mA, 700 mA) to ensure that any lumen drop is attributable to the LED’s intrinsic degradation rather than power supply drift.
The Climate Test Equipment | LISUN IEC 60068 Temperature Humidity Chamber is not merely a lab tool; it is an integral component of the production quality assurance loop.
5.1 Production Batch Qualification (PBQ)
R&D engineers use the system to qualify new phosphor mixtures or chip bonding materials. A typical PBQ test involves:
- Sampling 20 units from a new production run.
- Loading them into the IEC 60068 chamber at 85°C.
- Running a 1000-hour test to check for early failures (infant mortality).
- Extrapolating to L70 using the Arrhenius Model.
If the projected L70 is >50,000 hours, the batch passes.
5.2 Third-Party Lab Verification
Third-party testing technicians rely on the system’s traceability. The software logs ambient temperature, humidity, and chamber pressure continuously, creating an unalterable audit trail. This is critical for issuing reports that are accepted by Energy Star and the Department of Energy (DOE).
The high-resolution data provided by the system allows engineers to diagnose specific failure modes within the LED package.
6.1 Phosphor Degradation vs. Chip Decay
By analyzing the spectral power distribution (SPD) at each test interval, the software distinguishes between:
- Phosphor degradation: A drop in the yellow emission band (570-590 nm) relative to the blue pump (450 nm).
- Chip Decay: A uniform drop across all wavelengths.
The system plots the ΔCCT and ΔDuv (distance from the black body locus) over time, providing a direct view of color shift.
6.2 Solder Joint Failure Detection
In cyclical mode, a sudden increase in forward voltage ((V_f)) at high temperature indicates thermal expansion stress on solder joints. The software triggers an alarm if (V_f) exceeds 5% of its initial value, allowing engineers to halt the test and perform cross-sectional analysis.
Beyond IES standards, the equipment is designed to meet the rigorous requirements of the CIE 084 (Light Measurement) and CIE 70 (Aging of LEDs) standards.
7.1 CIE 127 and Spatial Uniformity
For devices tested under LM-84, the system supports the CIE 127 methodology for measuring total flux in a 2π or 4π configuration. The integrating sphere is calibrated using a NIST-traceable standard lamp, maintaining a measurement uncertainty of < 2% across the 380-780 nm spectrum.
7.2 IEC 60068 Environmental Stress Testing
The chamber itself adheres to IEC 60068-2-1 (Cold) and IEC 60068-2-78 (Damp Heat). It achieves a temperature ramp rate of 3°C/min and a humidity stability of ±2% RH. This ensures that the environmental stress applied to the LED samples is consistent and reproducible, meeting the stringent requirements of the Climate Test Equipment domain.
The integration of the Climate Test Equipment | LISUN IEC 60068 Temperature Humidity Chamber with the LEDLM-80PL/84PL Optical Aging Test Instrument provides a holistic, data-driven solution for LED reliability engineering. By enforcing the strict protocols of IES LM-80, TM-21, and the CIE standards, the system transforms a 6000-hour test into an accurate L70/L50 lifetime prediction. The dual system variants—optimized for either individual LEDs or complete modules—offer flexibility for any production line or testing lab. For engineers seeking to reduce warranty costs and improve product quality, this platform delivers the granularity, auditability, and statistical rigor required in the modern solid-state lighting industry. The ability to connect up to 3 chambers and run Arrhenius Model-based predictions ensures that your product’s lifespan is not guessed, but calculated.
Q1: How does the LISUN system differentiate between the failure of the LED chip versus the failure of the phosphor?
A: The system achieves this through spectral analysis. During the aging test, the LEDLM software captures the full spectral power distribution (SPD) at each measurement interval. If the intensity of the blue peak (typically 450 nm) decreases proportionally with the yellow phosphor peak (560 nm), it indicates chip degradation. However, if the blue peak remains stable while the yellow peak drops—and the correlated color temperature (CCT) shifts blue—it indicates phosphor failure. The software quantifies this as a ΔCCT shift. For LM-80 compliance, the report will include this color shift data, which is crucial for high-CRI applications where color consistency is as important as lumen maintenance.
Q2: Can I use the LEDLM-80PL to test high-power COB (Chip-on-Board) LEDs?
A: Yes, but with specific configuration requirements. The LEDLM-80PL is primarily designed for single individuated LEDs. For COB modules, which operate at higher currents (e.g., 2A – 10A) and require different heat sinking, the LEDLM-84PL is the recommended variant. The LM-84 standard is designed for LED modules and engines. For COB testing, you must use the high-current power supply option from LISUN and ensure the temperature chamber’s cold plate is sized to handle the larger thermal footprint of the COB. The software allows you to input the specific drive current and case temperature target, ensuring compliance with the TM-28 extrapolation model.
Q3: What is the minimum test duration required to get a reliable L70 projection using the Arrhenius Model?
A: According to IES LM-80 and TM-21, the minimum test duration is 6000 hours (approx. 8.5 months) at three different temperatures. The system will calculate the Arrhenius Activation Energy (Ea) only if the data shows a monotonic decay. However, for a preliminary screening (Production Batch Qualification), a 1000-hour test at a single high temperature (e.g., 105°C) can provide an early warning of infant mortality. The software will generate a “projected” L70, but this is considered an estimate, not a full TM-21 compliant report, until the 6000-hour data set is complete. The system automatically flags the report if the extrapolation exceeds the 6x rule (the projection cannot exceed 6 times the test duration).