




Abstract
This article provides a comprehensive technical overview of LED Chip Test: Precision Thermal & Optical Analysis per IEC Standards, focusing on methodologies for assessing lumen depreciation and color shift. It highlights the critical role of the LISUN LEDLM-80PL and LEDLM-84PL systems in facilitating IES LM-80 and LM-84 compliance. The discussion covers advanced thermal management via the Arrhenius Model, dual testing modes, and data extrapolation techniques like TM-21. Readers will gain actionable insights into hardware configurations, including support for up to 3 temperature chambers, ensuring accelerated aging tests yield reliable L70/L50 lifespan predictions. This guide is essential for R&D engineers seeking robust LED chip validation.
1.1 Why Thermal and Optical Analysis is Non-Negotiable
LED chip failure modes are predominantly thermally activated. Without precise thermal control during testing, photometric data becomes skewed, leading to inaccurate lifespan projections. Optical analysis, conversely, quantifies total luminous flux depreciation and chromaticity shift, which are pivotal parameters for lighting quality. A robust test platform must therefore isolate temperature variables while maintaining photometric integrity. This dual requirement forms the foundation of standardized testing, ensuring that a 6000-hour test duration yields statistically significant data rather than experimental noise.
1.2 Mapping the Regulatory Landscape
The transition from traditional lighting to solid-state lighting (SSL) has necessitated stringent guidelines for lifetime assessment. Standards such as IES LM-80 (for lumen maintenance of LED packages) and IES LM-84 (for integral LED lamps) provide the framework for raw data collection. Subsequently, TM-21 and TM-28 offer mathematical extrapolation models to predict long-term performance from short-term data. Compliance with these norms is a prerequisite for Energy Star and DLC listings, making precision testing equipment a non-negotiable asset for manufacturers aiming for global market access.
2.1 LEDLM-80PL vs. LEDLM-84PL: Dual System Capabilities
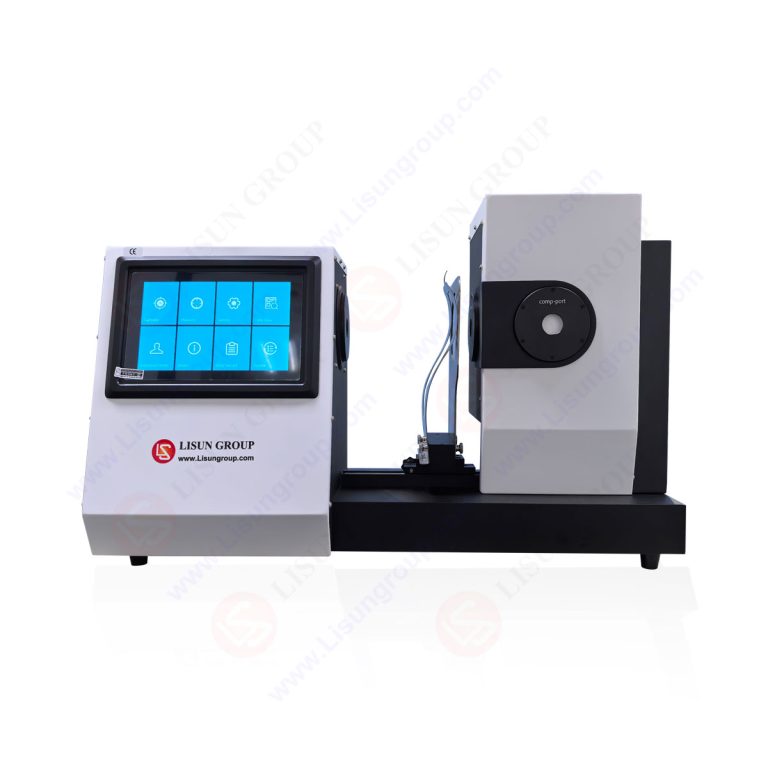
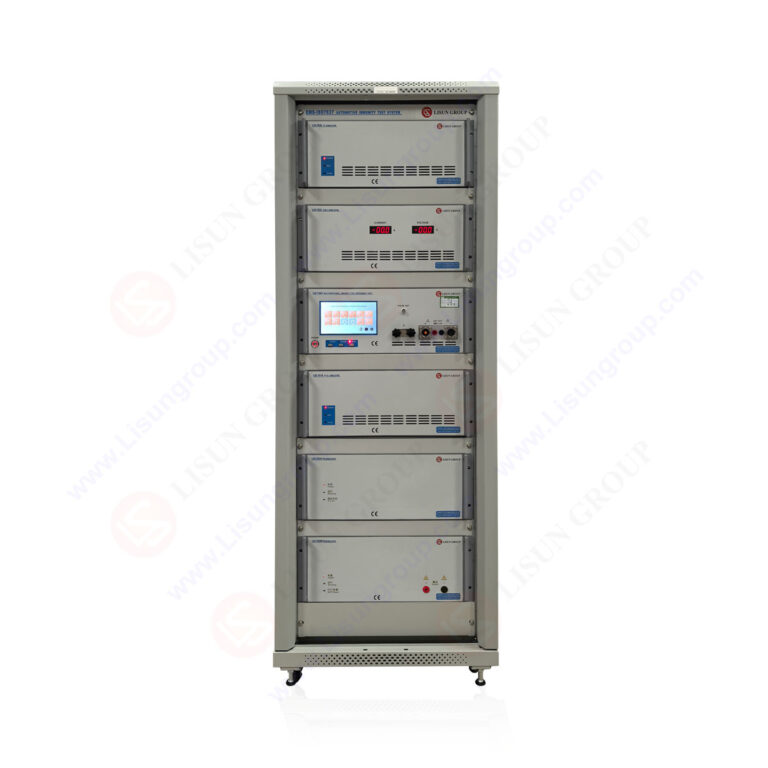
The LISUN LEDLM-80PL is engineered specifically for testing LED packages, arrays, and modules to facilitate LM-80 data generation. Its sister system, the LEDLM-84PL, is tailored for integral LED lamps, aligning with the LM-84 standard. Both systems feature high-precision integrating spheres and spectroradiometers, but they differ in their fixture design and photometric range to accommodate different form factors. The table below contrasts their core operational specifications, highlighting their distinct roles in the testing ecosystem.
Table 1: Comparative Specifications of LISUN LEDLM Series Variants
| Specification | LEDLM-80PL | LEDLM-84PL |
|---|---|---|
| Target Standard | IES LM-80 / TM-21 | IES LM-84 / TM-28 |
| Measurement Parameter | Luminous Flux, CCT, CRI | Luminous Flux, CCT, CRI |
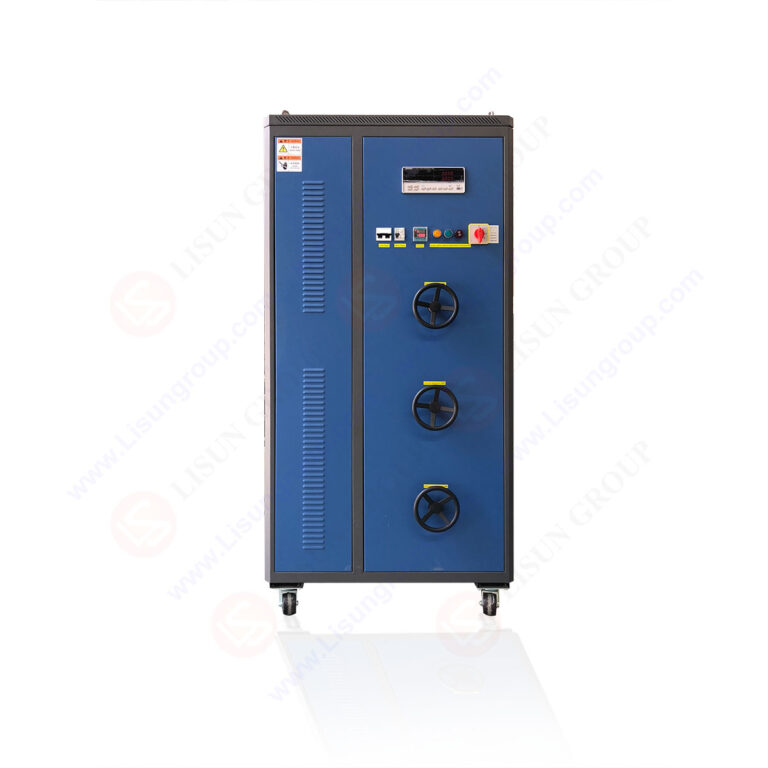
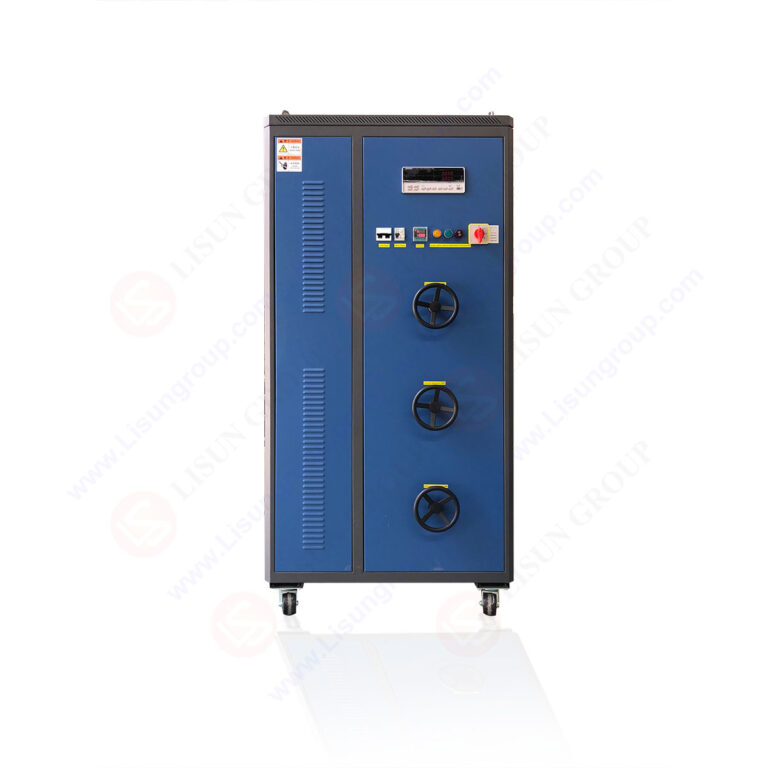
| Temperature Control | Up to 3 Connected Chambers | Up to 3 Connected Chambers |
| Test Duration | 6000+ Hours (Standard) | 6000+ Hours (Standard) |
| Aging Mode | Constant Current / Constant Voltage | Constant Current / Constant Voltage |
| Photometric Setup | Integrating Sphere (1m/2m options) | Integrating Sphere (2m/3m options) |
2.2 Customizable Configurations for Diverse Chip Geometries
LED chip sizes and thermal pads vary significantly across manufacturers. The LEDLM series offers customizable test boards and mounting fixtures to ensure thermal coupling between the chip under test (CUT) and the temperature-controlled plate. This modularity ensures that the case temperature (Tc) measurement point is consistent with the LM-80 standard, which specifies that data must be recorded at specific Tc points (typically 55°C, 85°C, and a third user-defined temperature). The ability to switch between 4-wire Kelvin connections and standard sockets allows for accurate current injection without lead resistance errors.
3.1 Integration of the Arrhenius Model in Software
LISUN’s dedicated software suite embeds the Arrhenius equation to accelerate the aging process. By elevating the ambient temperature within the thermal chambers, the chemical reaction rates within the LED die and phosphor are accelerated. The software calculates the activation energy (Ea) from the collected slope data, allowing engineers to extrapolate lifespan at a lower, real-world operating temperature. This mathematical modeling is crucial because a 6000-hour test at 105°C can effectively simulate years of operation at 25°C, provided the failure mechanism remains consistent.
3.2 Multi-Chamber Synchronization and Data Logging
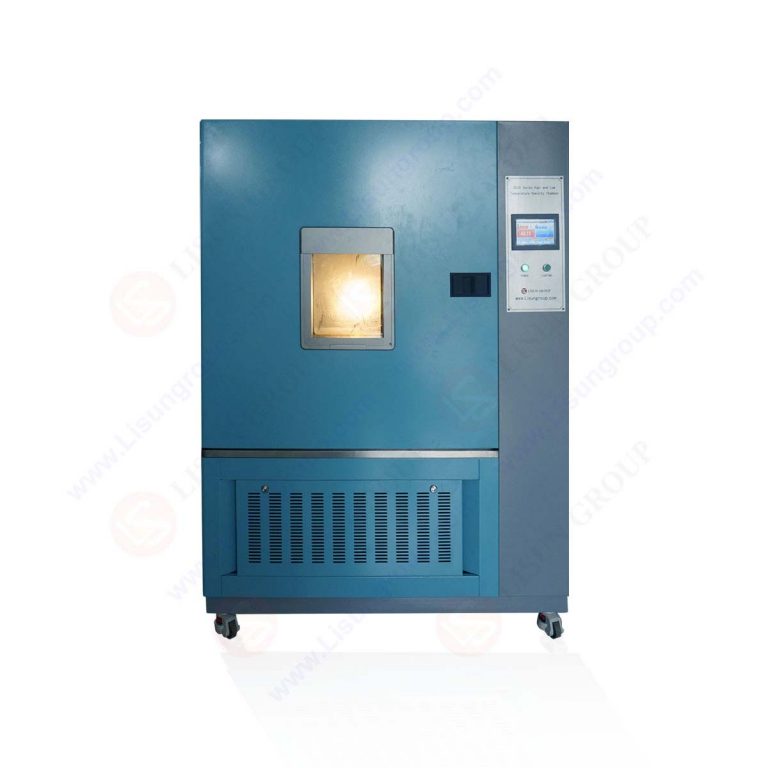
The capability to support up to 3 connected temperature chambers (e.g., at 55°C, 85°C, and 105°C) allows for simultaneous testing under different thermal stresses. The control system independently regulates each chamber’s temperature stability (±2°C tolerance) and logs data at user-defined intervals (e.g., every 1000 hours). This parallel processing ensures that the activation energy calculation is based on multiple data points, enhancing the statistical confidence of the TM-21 extrapolation. Engineers can thus identify the “knee” in the lumen depreciation curve, determining the onset of rapid degradation.
4.1 Integrating Sphere Methodology per CIE 127
The optical path utilizes a large-diameter integrating sphere (up to 3 meters for LEDLM-84PL) to capture total luminous flux. This aligns with CIE 127 guidelines for measuring LEDs, ensuring that spatial radiation patterns do not introduce measurement errors. The sphere’s interior coating (barium sulfate or PTFE) provides high reflectance (>97%) for accurate photometric integration. Concurrently, a spectroradiometer analyzes the spectral power distribution (SPD), allowing for the calculation of CCT, CRI, and chromaticity coordinates (u’, v’).
4.2 Tracking L70/L50 Lifespan Metrics
The critical output of the test is the determination of L70 (time to 70% lumen maintenance) or L50 (time to 50% lumen maintenance). The software plots lumen maintenance against time, applying a curve fit to project when the threshold will be crossed. For instance, if the system runs for 6000 hours and the output drops to 92%, the TM-21 model will extrapolate the curve to the 70% threshold. The precision of this extrapolation depends heavily on the absence of optical contamination (e.g., dust on the sphere) and the stability of the power supply, which the LISUN system monitors continuously.
5.1 Mode Selection Criteria
Different LED chips exhibit different sensitivities to current and voltage variations. Constant Current (CC) mode is the industry default for solid-state lighting, as it maintains a stable photon flux density. However, some specialized chips or automotive applications require Constant Voltage (CV) driving. The LEDLM series allows seamless switching between these modes without recalibrating the optical bench, ensuring that the test conditions match the intended driver design. This flexibility is pivotal when testing chips destined for linear drivers versus switch-mode power supplies.
5.2 Impact on Lumen Depreciation Data
The choice of load mode directly influences the junction temperature (Tj). In CC mode, a rise in Tj typically decreases light output but may increase forward voltage (Vf), leading to a slight power increase. In CV mode, current may decrease with temperature, altering the stress profile. The LISUN data acquisition system records Vf and If continuously, allowing the Arrhenius software to calculate the true power dissipation and adjust the Tj estimate. This dual capability ensures that the LMS-80PL and LMS-84PL deliver accurate data irrespective of the electronic driving topology.
6.1 Algorithmic Fitting and Projection
The TM-21 standard prescribes a specific exponential decay formula for projecting lumen maintenance. The LISUN software automatically sorts the 6000-hour data (mandatory minimum per TM-21) and applies a non-linear least squares fit to the logarithmic data. It then calculates the projected L70(6k) value. The software validates the goodness-of-fit (R² value) and flags any anomalies, ensuring that the extrapolation does not violate the physical limits of the LED chip. This automated process reduces human error and accelerates the reporting cycle for quality control teams.
6.2 Handling TM-28 for Integral Lamps
For integral lamps tested on the LEDLM-84PL, the TM-28 standard allows for a different extrapolation method compared to TM-21. While TM-21 focuses strictly on the LED package, TM-28 includes the effects of the driver and diffuser. The software applies a similar model but incorporates a correction factor for optical loss in the diffuser. By comparing the LLMF (Lamp Lumen Maintenance Factor) data from the initial (0-hour) and interim (6000-hour) readings, the system generates a forecast that aligns with the final product’s behavior, not just the chip’s.
7.1 IES LM-79-19 for Electrical and Photometric Testing
While LM-80 focuses on aging, IES LM-79-19 is the benchmark for steady-state measurements of electrical and photometric parameters. The LEDLM series integrates LM-79-19 testing protocols for the 0-hour and interim readings. This standard requires specific ambient temperature conditions (25°C ±1°C) and a stable AC/DC power source. By synchronizing LM-79-19 measurements within the aging cycle, the system ensures that the “initial” data point is comparable to final data, preventing drift in calibration between separate test setups.
7.2 Alignment with CIE 084 and CIE 070
The photometric calibration of the integrating sphere references CIE 084 (measurement of luminous flux) and CIE 070 (measurement of luminous intensity distribution) standards. The software adheres to these guidelines for stray light correction and spatial non-uniformity. This ensures that the absolute photometric values (lumens) are traceable to national metrology institutes. Compliance with these broader CIE standards protects the integrity of the L70/L50 predictions, as a 1% error in absolute flux measurement can translate to a 10% error in lifespan projection.
In the realm of solid-state lighting, the convergence of thermal stress and optical characterization is mandatory for product reliability. This article has detailed how precision thermal & optical analysis per IEC standards is realized through the LISUN LEDLM series. The integration of the Arrhenius Model, dual test modes, and up to 3 temperature chambers yields robust data sets for TM-21 extrapolation. By adhering to IES LM-80, LM-84, and CIE 127 standards, manufacturers can confidently predict L70/L50 metrics, reducing warranty risks and accelerating certification timelines. The customizable hardware ensures applicability across various chip architectures, solidifying the position of these systems as foundational tools for LED engineering teams striving for market leadership.
Q1: What is the primary difference between IES LM-80 and IES LM-84 in the context of the LEDLM-80PL and LEDLM-84PL systems?
A: The fundamental difference lies in the device under test. IES LM-80 (LEDLM-80PL) is strictly for LED packages, arrays, and modules, requiring case temperature (Tc) control. It excludes the driver and optics. Conversely, IES LM-84 (LEDLM-84PL) applies to integral LED lamps and luminaires, where the driver is included, and the ambient temperature is the controlled variable. The LISUN systems are physically optimized accordingly—the LM-84PL features larger sphere sizes to accommodate the physical dimensions of a complete lamp, whereas the LM-80PL focuses on smaller, high-precision thermal boards for bare chips.
Q2: How does the Arrhenius model improve the accuracy of LM-80 data extrapolation?
A: The Arrhenius model provides a scientific basis for scaling accelerated aging results to real-world conditions. It postulates that the rate of lumen depreciation is exponentially proportional to the reciprocal of the junction temperature. By testing at 55°C, 85°C, and 105°C, the LISUN software calculates the activation energy (Ea) specific to that LED’s phosphor and die materials. This Ea value is far more accurate than using a generic default (e.g., 0.7 eV) because it is empirically derived from the specific test data, thereby enhancing the confidence interval of the TM-21 projection over a 6,000-hour test duration.
Q3: Can the LISUN system perform tests beyond the 6000-hour minimum requirement?
A: Yes, absolutely. While 6000 hours is the mandatory minimum for LM-80 and LM-84 qualification, the system is designed for extended, continuous operation. Many R&D labs run tests for 10,000 hours or more to obtain a direct L70 measurement rather than relying solely on extrapolated data. The robust thermal insulation and power supply stability of the LEDLM series are designed to maintain accuracy in these long-duration tests. The software supports a rolling data window, meaning it will automatically recalculate the extrapolation coefficients as new 1000-hour data points are added, providing progressive precision to the engineering team.