

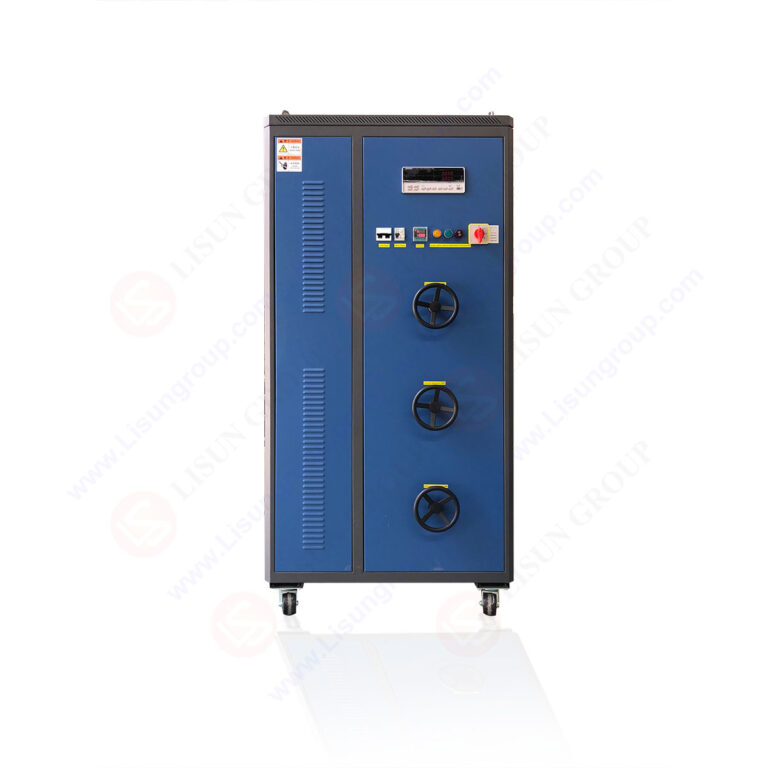



Precision Power Measurement in Solid-State Lighting: A Comprehensive Guide to AC/DC Digital Power Meters for Harmonic Analysis
Abstract
The AC/DC digital power meter for harmonic analysis has become an indispensable instrument in solid-state lighting electrical testing, enabling precise measurement of voltage, current, power, power factor, and total harmonic distortion across LED driver circuits and luminaire systems. These precision power meters deliver accuracy classes spanning 0.1% to 0.5%, frequency response from 0.5Hz to 100kHz, and harmonic analysis capabilities covering up to the 50th order. This article provides a comprehensive technical examination of AC/DC energy analyzers, their operational principles, compliance applications, and selection criteria for LED manufacturing facilities, automotive electronics validation laboratories, and EMC testing environments. We explore how digital sampling waveform analysis, automatic range switching, and IEC/CSA harmonic calculation methods enable reliable power quality assessment and regulatory compliance verification for modern lighting products.
1. Evolution and Technical Foundations of Precision Power Meters
1.1 Digital Sampling Architecture in Modern Power Analysis
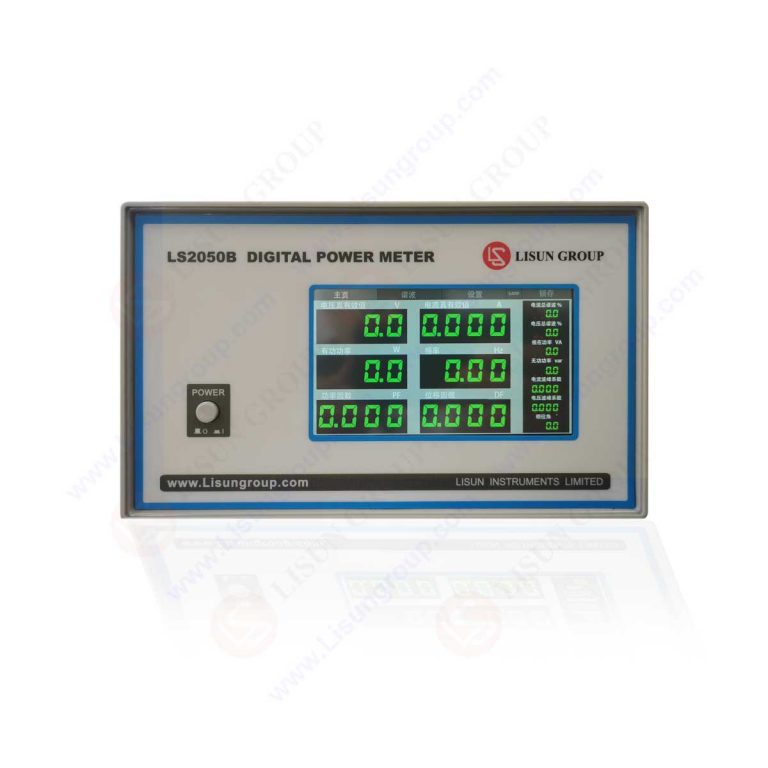
Contemporary AC/DC digital power meters represent a radical departure from analog wattmeter designs. The core architecture employs high-speed digital sampling waveform analysis, where voltage and current signals are simultaneously digitized at rates exceeding 200 kS/s. This approach captures the true waveform shape, including non-sinusoidal characteristics inherent to LED drivers with switch-mode power supplies. The digital sampling method enables calculation of true RMS values, active power, apparent power, reactive power, and power factor with exceptional fidelity. Critical to this architecture is the anti-aliasing filter, which removes high-frequency components above the Nyquist frequency before analog-to-digital conversion. Modern instruments in this category, such as the LISUN LS2050 series, integrate these front-end circuits with FPGA-based processing engines to achieve measurement bandwidths extending from 0.5Hz to 100kHz. This wide frequency range accommodates everything from fundamental line frequencies to high-order switching harmonics in LED drivers.
1.2 Automatic Range Switching and Dynamic Performance
Automatic range switching represents a defining capability for practical solid-state lighting electrical testing. LED products exhibit wide variations in power consumption—from sub-watt indicator lamps to 400W high-bay fixtures—and current draws spanning microamps to tens of amps. Manual range selection introduces measurement uncertainty and slows production throughput. The automatic range switching system continuously monitors input signals and selects optimal measurement ranges without interrupting the measurement cycle. Key performance parameters include range transition times below 10ms and hysteresis control to prevent oscillation at range boundaries. The LISUN LS2050 series exemplifies this capability with instantaneous overload surviving up to 1600V maximum voltage and 50A maximum current, providing robust protection during surge events or inrush current testing. This dynamic range capability proves particularly valuable when testing LED drivers that exhibit high crest factors—often exceeding 3:1—requiring the measurement system to accurately capture both low-magnitude RMS values and peak-containing waveforms.
1.3 Measurement Parameters and Signal Processing Chain
The precision power meter must extract comprehensive electrical parameters from raw digitized signals. Processing algorithms compute AC/DC voltage and current (true RMS), active power (P), apparent power (S), reactive power (Q), and the complete power factor spectrum including both displacement factor and distortion factor components. Frequency measurement operates continuously across the 0.5Hz-100kHz range, enabling analysis of both standard line frequencies (50/60Hz) and variable-frequency drive outputs. For solid-state lighting applications, the displacement factor—representing the phase relationship between fundamental current and voltage components—becomes particularly relevant when evaluating power factor correction circuits. The processing chain maintains synchronization between voltage and current channels through inter-channel sampling alignment, ensuring phase angle accuracy better than 0.05 degrees at frequencies up to 1kHz. This precision directly impacts power measurement accuracy, as phase errors propagate multiplicatively into power and power factor calculations.
2. Harmonic Analysis Methodology and Implementation
2.1 FFT-Based Total Harmonic Distortion Measurement
Harmonic analysis in modern digital power meters employs Fast Fourier Transform algorithms applied to captured waveform samples. The instrumentation computes individual harmonic components up to the 50th order, following the analytical framework prescribed by IEC 61000-4-7. Two calculation methodologies exist: the simple Fast Fourier Transform and the group-based analysis using rectangular or Hanning windows. The IEC/CSA method adopted in instruments like the LS2050C-IEC specifically addresses the grouping requirements for interharmonic exclusion, ensuring that measured harmonic magnitudes accurately represent spectral components at discrete harmonic frequencies. Total harmonic distortion (THD) is calculated as the ratio of the square root of the sum of squares of all harmonic components to the magnitude of the fundamental component, typically expressed as a percentage. The measurement system simultaneously provides individual harmonic orders with magnitude and phase information, enabling comprehensive power quality assessment.
2.2 Harmonic Compliance Testing per EN/IEC 61000-3-2
For solid-state lighting products, harmonic current emission limits are governed by EN/IEC 61000-3-2. This standard classifies LED lighting equipment under Class C limits, imposing specific constraints on harmonic current magnitudes relative to the fundamental component. Compliance testing requires precision measurement of individual harmonic orders under defined test conditions—typically at rated voltage with the lamp operating at maximum power. The AC/DC digital power meter configured for harmonic analysis must measure with sufficient accuracy that measurement uncertainty does not compromise pass/fail determinations. The LS2050C-IEC model integrates the complete harmonic analysis chain compliant with IEC 61010 safety requirements, providing the measurement integrity essential for certification testing at accredited EMC laboratories. Critical compliance parameters include the third harmonic limit of 30% of fundamental current, fifth harmonic at 10%, and total harmonic distortion below 35% for Class C equipment, with cosine phi correction factors applied to harmonics above the fifth order.
2.3 Distinguishing Power Factor Components for LED Drivers
Power factor in non-linear loads requires decomposition into displacement factor and distortion factor components. The displacement factor quantifies phase displacement between fundamental voltage and current, while distortion factor accounts for harmonic content. LED drivers with active power factor correction typically achieve displacement factors above 0.99 but may exhibit distortion factors introducing additional losses. The precision power meter calculates total power factor as the product of displacement and distortion factors. This decomposition proves essential for engineers optimizing driver designs toward Energy Star or DLC requirements. The LS2050 series provides simultaneous display of all three metrics—power factor, displacement factor, and distortion factor—enabling rapid design iteration and failure analysis.
3. Measurement Accuracy and Calibration Considerations
3.1 Accuracy Class Evaluation for Production Testing Applications
High accuracy power meters directly impact production yield and warranty costs. The LS2050C model achieves 0.1% basic accuracy for power measurement, while the LS2050B provides 0.5% accuracy for general-purpose applications. These accuracy ratings apply under specified conditions, including power factor (typically PF=1), temperature range, and input signal purity. When testing typical LED drivers with power factors ranging from 0.6 to 0.95, additional errors from phase measurement inaccuracies become germane. The high-accuracy instrument maintains phase error below 0.03 degrees at 50/60Hz, translating to power measurement uncertainty contribution below 0.05% for power factors above 0.9. For production line applications, the balance between measurement accuracy and instrument cost must be evaluated against product specifications and regulatory thresholds.
3.2 Bandwidth and Crest Factor Handling in Modern LED Systems
Modern LED drivers utilize valley-fill passive power factor correction or active switching circuits operating at frequencies exceeding 100kHz. The measurement instrument must accommodate wide-bandwidth signals without introducing aliasing or bandwidth-limitation errors. The 100kHz measurement bandwidth of the LS2050 series accommodates the fundamental switching frequency and its low-order harmonics. Crest factor—the ratio of peak amplitude to RMS value—presents another measurement challenge. LED driver input currents often exhibit crest factors between 2.5 and 4.0, requiring analog-front-end headroom beyond 1.4 times full-scale RMS to prevent clipping. Precision instruments achieve crest factor capability of 3:1 at full-scale reading and up to 10:1 at de-rated levels, ensuring accurate measurement of spiky current waveforms. This dynamic capability prevents measurement errors that would otherwise manifest as artificially reduced RMS or power readings.
3.3 Overload Protection and Instrument Reliability
Industrial environments subject test instruments to transient events, including load switching surges, electrostatic discharge, and lightning-induced transients. The high overload capacity design philosophy implemented in industrial-grade instruments places premium on survival capability. The 1600V instantaneous voltage overload and 50A current overload ratings allow these instruments to withstand short-duration transients without damage—critical for production environments where electrical disturbances occur with unpredictable frequency. Internal protection circuits employ transient voltage suppressors, current-limiting elements, and thermal protection to provide staged defense against progressively severe overload events. This safety engineering aligns with internal controls mandated by IEC 61010 measurement category requirements, ensuring operator safety and instrument longevity.
4. Communication Interfaces and Data Acquisition Strategies
4.1 RS232 and RS485 Integration for Automated Test Systems
Modern manufacturing execution systems demand seamless data integration from measurement instruments. The RS232 and RS485 communication ports on precision power meters provide the connectivity backbone for automated test sequences. RS232 delivers simple point-to-point communication at distances up to 15 meters with baud rates reaching 115.2kbps. RS485 enables multi-drop configurations supporting up to 32 instruments on a single bus, extending cable runs to 1200 meters—ideal for production lines with distributed test stations. The communication protocol provides command sets for instrument configuration, measurement initiation, and data retrieval. Engineers can implement direct commands for individual measurement cycle control or use continuous data streaming modes for real-time monitoring applications. Standard SCPI (Standard Commands for Programmable Instruments) command compatibility ensures interoperability with existing laboratory software infrastructure from National Instruments, Keysight, and other test automation platforms.
4.2 Data Logging and Statistical Process Control Integration
The digital power meter’s measurement speed becomes the critical parameter for statistical process control applications. Polling rates up to 50 readings per second for basic parameters enable real-time trend analysis and rapid fault detection. For harmonic analysis, measurement intervals are longer due to processing requirements—typically 1-2 seconds for complete 50th-order analysis. Production environments can implement statistical process control using these instruments by calculating process capability indices, monitoring trend shifts, and triggering corrective actions when measurements drift beyond control limits. Historically, the data logging capabilities enable traceability for Quality Management System compliance under ISO 9001 requirements. The combination of high-speed communication, reliable data integrity checking, and synchronization with external trigger signals creates a robust platform for closed-loop production control systems.
5. Comparative Model Analysis: Selecting Appropriate Instrumentation
5.1 Technical Specification Comparison across Model Tiers
Selection between available instrument models requires systematic evaluation against application requirements. The LS2050B serves as the general-purpose entry point, providing 0.5% accuracy for routine production testing, incoming inspection, and field service applications. The LS2050C elevates accuracy to 0.1% for R&D characterization, calibration laboratory reference, and applications requiring the highest measurement certainty. The LS2050C-IEC adds pre-programmed harmonic compliance testing to the high-accuracy platform, specifically targeting EMC laboratories conducting EN/IEC 61000-3-2 certification testing.
| Parameter | LS2050B | LS2050C | LS2050C-IEC |
|---|---|---|---|
| Basic Power Accuracy | 0.5% | 0.1% | 0.1% |
| Frequency Range | 0.5Hz-100kHz | 0.5Hz-100kHz | 0.5Hz-100kHz |
| Harmonic Analysis | Up to 50th | Up to 50th | Up to 50th (IEC CSA method) |
| EN/IEC 61000-3-2 Compliance Setup | Manual configuration | Manual configuration | Pre-programmed |
| Crest Factor Capability | 3:1 | 3:1 | 3:1 |
| Communications | RS232/RS485 | RS232/RS485 | RS232/RS485 |
| Instantaneous Overload Current | 50A | 50A | 50A |
| Instantaneous Overload Voltage | 1600V | 1600V | 1600V |
| Typical Application | Production inspection | R&D and metrology | EMC certification |
5.2 Matching Instrument Capabilities to Application Requirements
Production testing of LED luminaires typically requires speed and reliability more than ultimate accuracy. The LS2050B provides sufficient accuracy for pass/fail testing against product specifications with measurement tolerances of ±5% or greater. Engineering validation departments developing new LED driver topologies benefit from the LS2050C’s enhanced accuracy, revealing subtle circuit inefficiencies that may be obscured at lower measurement fidelity. Independent EMC testing laboratories performing certification testing under accreditation schemes must employ instruments providing documented traceability and compliance with measurement methodology requirements. The LS2050C-IEC addresses this niche with pre-configured test sequences, standardized calculation methods, and compliance-oriented data reporting formats. The calibration laboratory maintaining corporate measurement standards requires the highest accuracy tier to validate reference standards and characterize transfer standards.
6. Application-Specific Test Methodologies
6.1 Production Line Testing for LED Luminaires
Manufacturing environments require test sequences balancing coverage, speed, and cost. Typical solid-state lighting production test stations perform the following measurements within a 10-15 second test cycle: input voltage and frequency verification, input current magnitude, active power draw, power factor and displacement factor assessment, and optional harmonic current screening. The automatic range switching functionality eliminates manual intervention while accommodating the power variations between production runs. Statistical protocol limits derived from design targets and regulatory requirements determine pass/fail criteria. Traceability of test results back to specific instrument serial numbers and calibration dates satisfies audit requirements from customers and certification bodies.
6.2 R&D Characterization of LED Driver Circuits
Research and development validation explores the interaction between LED driver circuits and their power supplies across extended operating envelopes. Voltage sweep testing from 80-110% of nominal supply voltage, frequency variation testing at 47-63Hz, and temperature chamber testing across the product’s operating range require the power meter to maintain specified accuracy across these changing conditions. The 100kHz bandwidth enables analysis of conducted emissions in the 10kHz-100kHz range that may affect EMC compliance. Harmonic analysis during single-event tests—such as phase-angle turn-on at voltage zero-crossings or inrush current events—provides design insight into power quality impact. Engineers can export measurement data for post-processing in tools such as MATLAB or Python to correlate electrical characteristics with photometric performance measured by integrating spheres and spectroradiometers.
7. Workflow Integration for Comprehensive Lighting Product Validation
7.1 Combining Electrical and Photometric Measurements
Comprehensive solid-state lighting product validation demands correlation between electrical and photometric performance. This workflow integrates the power meter with integrating sphere systems, goniophotometers, and spectroradiometers—all under synchronizing control from central test software. This integration characterizes luminous efficacy of the complete luminaire, correlating input electrical power precisely measured by the digital meter with lumen output measured by the photometric system. This approach aligns with the LM-79 standard methodology for electrical and photometric measurements of solid-state lighting products. The measurement architecture enables simultaneous acquisition of electrical parameters, spectral power distribution, and luminous flux without introducing temporal drift that could compromise correlation accuracy. Temperature-dependent power measurements for thermal design validation can be synchronized with photometric measurements at each thermal equilibrium point.
7.2 Enabling EMC Compliance Testing Workflow
Complete electromagnetic compatibility evaluation of lighting products integrates the power meter for pre-compliance and compliance testing. During pre-compliance screening, engineers measure harmonic currents to predict EN/IEC 61000-3-2 performance before submission to certified testing laboratories. This screening typically occurs alongside conducted emission measurements using spectrum analyzers and line impedance stabilization networks according to EN/IEC 61000-3-2 test configurations. If harmonic measurements approach regulatory limits, engineers can iterate on power factor correction circuit designs and re-test rapidly within the same test setup. The power meter’s compliance reporting features generate summary reports indicating pass or fail status per harmonic order, presenting data in the format recognized by certification auditors.
8. Conclusion
The AC/DC digital power meter for harmonic analysis embodies the measurement precision required for modern solid-state lighting electrical testing. Through digital sampling waveform analysis, automatic range switching, and comprehensive harmonic computation capabilities, these instruments enable manufacturers to quantify electrical performance with accuracy classes from 0.1% to 0.5% across a frequency spectrum extending from 0.5Hz to 100kHz. The family of instruments—from the general-purpose LS2050B to the compliance-oriented LS2050C-IEC—provides appropriate solutions across production testing, engineering characterization, and EMC certification applications. Integration with production systems through RS232 and RS485 interfaces enables automated data acquisition and statistical quality monitoring. The combined measurement of power quality parameters, harmonic emissions, and power factor components supports compliance verification with EN/IEC 61000-3-2, LM-79, IEC 61010, and UL 1989 requirements. Engineers, quality managers, and laboratory technicians gain a complete measurement platform that delivers reliable data for product optimization, regulatory certification, and supply chain quality assurance in the evolving solid-state lighting industry.
FAQ
Q1: What distinguishes between displacement factor and total power factor when testing LED drivers with a digital power meter?
A: Displacement factor measures only the phase relationship between the fundamental voltage and current components, indicating the efficiency of reactive power compensation—particularly relevant for LED lamps with passive power factor correction circuits. Distortion factor quantifies the degree of waveform deformation caused by nonlinear load currents, which affect the harmonic currents emitted by LED drivers. Total power factor combines both factors as their mathematical product. For LED drivers with active power factor correction achieving near-sinusoidal current waveforms, displacement factor approaches 1.0, and total power factor closely matches displacement factor values. However, if circuit design or component tolerance issues produce waveform distortion, distortion factor degrades below unity, reducing total power factor even when phase relationship appears correct. The LS2050 series displays both values simultaneously, enabling engineers to isolate whether power factor deficiencies originate from reactive component tuning or harmonic generation problems.
Q2: How does the harmonic analysis method based on IEC 61000-4-7 grouping affect EMC testing results compared to simple FFT computation?
A: The IEC 61000-4-7 framework prescribes specific spectral analysis techniques, including frequency grouping of spectral bins around each harmonic frequency. This grouping method ensures that minor frequency deviations in the supply system—which may shift actual harmonic frequencies slightly from theoretical integer multiples of the fundamental—do not corrupt measurement results. Simple FFT computation without grouping can underestimate harmonic magnitudes when the spectral leakage occurs due to non-synchronous sampling or fluctuating fundamental frequency. Additionally, the IEC methodology specifies requirements for window functions, spectral resolution, and interharmonic exclusion. Adopting this measurement methodology, as implemented in the LS2050C-IEC model, ensures consistency between pre-compliance screening measurements and results obtained at accredited testing facilities. Without this alignment, products may pass internal screening but fail certification measurements because of measurement methodology discrepancies.
Q3: What overload protection considerations are essential when using power meters for surge testing and inrush current measurement?
A: Power meters installed in production environments may encounter transient events exceeding normal measurement ranges—including inrush currents during lamp turn-on, which can reach 20 times steady-state levels for LED drivers with capacitive input stages. Surge events from supply switching or nearby lightning strikes also present hazards. The protection architecture must respond at the input protection circuit level through current-limiting elements that clamp against excessive voltages and currents. Look for instruments with certified instantaneous overload ratings substantially above expected transient levels, such as the LS2050 series’ capability to withstand 1600V maximum instantaneous voltage and 50A maximum instantaneous current. After the transient passes, the instrument should automatically recover to normal measurement operation without latching into fault state. Additionally, verify the instrument conforms with IEC 61010 safety standards regarding operator protection against hazardous voltage exposure and internal component spacing requirements for high-voltage installations.
Q4: How frequently should a power meter used in LED testing be recalibrated to maintain measurement accuracy?
A: Calibration intervals depend on usage intensity, environmental conditions, and the criticality of measurements for product compliance. For production facilities operating instruments continuously, annual calibration against traceable reference standards is considered minimum best practice—and this interval aligns with typical ISO 9001 quality system expectations. Laboratories performing certification testing under ISO 17025 accreditation may require six-month calibration intervals for instruments providing primary evidence of compliance. When instruments undergo mechanical shock, exposure to out-of-specification inputs, or environmental extremes outside their specified operating range, immediate recalibration is required before continued use in compliance-related measurements. The calibration process verifies accuracy across the full measurement range, including various input frequencies and waveform shapes—not just at the nominal 50/60Hz sine wave conditions. This comprehensive calibration ensures validity of LF measurements, harmonic analysis results, and power factor determinations.